Highlight Region Between Two ggplot2 Lines with Color in R (Example Code)
In this tutorial you’ll learn how to highlight the region between two ggplot2 lines with color in the R programming language.
Setting up the Example
data(iris) # Loading example data head(iris) # Sepal.Length Sepal.Width Petal.Length Petal.Width Species # 1 5.1 3.5 1.4 0.2 setosa # 2 4.9 3.0 1.4 0.2 setosa # 3 4.7 3.2 1.3 0.2 setosa # 4 4.6 3.1 1.5 0.2 setosa # 5 5.0 3.6 1.4 0.2 setosa # 6 5.4 3.9 1.7 0.4 setosa |
data(iris) # Loading example data head(iris) # Sepal.Length Sepal.Width Petal.Length Petal.Width Species # 1 5.1 3.5 1.4 0.2 setosa # 2 4.9 3.0 1.4 0.2 setosa # 3 4.7 3.2 1.3 0.2 setosa # 4 4.6 3.1 1.5 0.2 setosa # 5 5.0 3.6 1.4 0.2 setosa # 6 5.4 3.9 1.7 0.4 setosa
install.packages("ggplot2") # Install & load ggplot2 package library("ggplot2") |
install.packages("ggplot2") # Install & load ggplot2 package library("ggplot2")
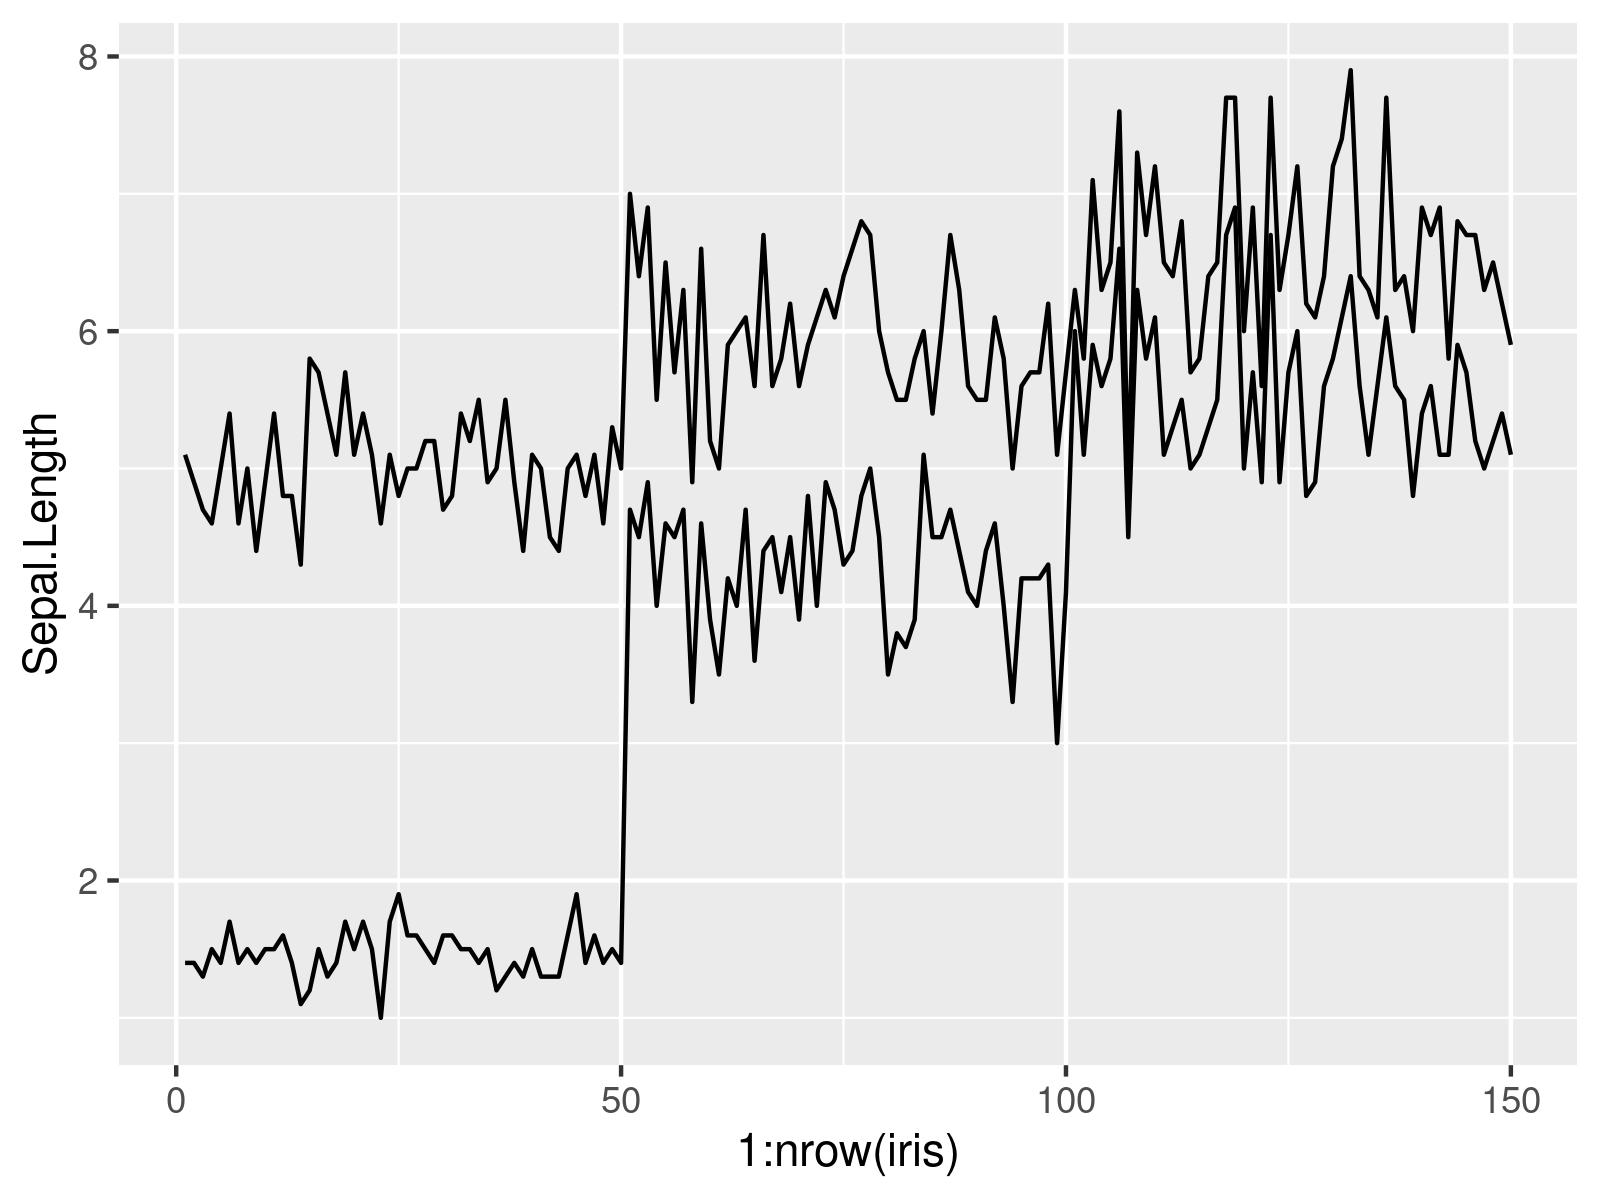
my_plot <- ggplot(iris, # Drawing a ggplot2 line plot aes(x = 1:nrow(iris))) + geom_line(aes(y = Sepal.Length)) + geom_line(aes(y = Petal.Length)) my_plot |
my_plot <- ggplot(iris, # Drawing a ggplot2 line plot aes(x = 1:nrow(iris))) + geom_line(aes(y = Sepal.Length)) + geom_line(aes(y = Petal.Length)) my_plot

Example: Highlighting the Area Between Two Lines in a ggplot2 Line Plot
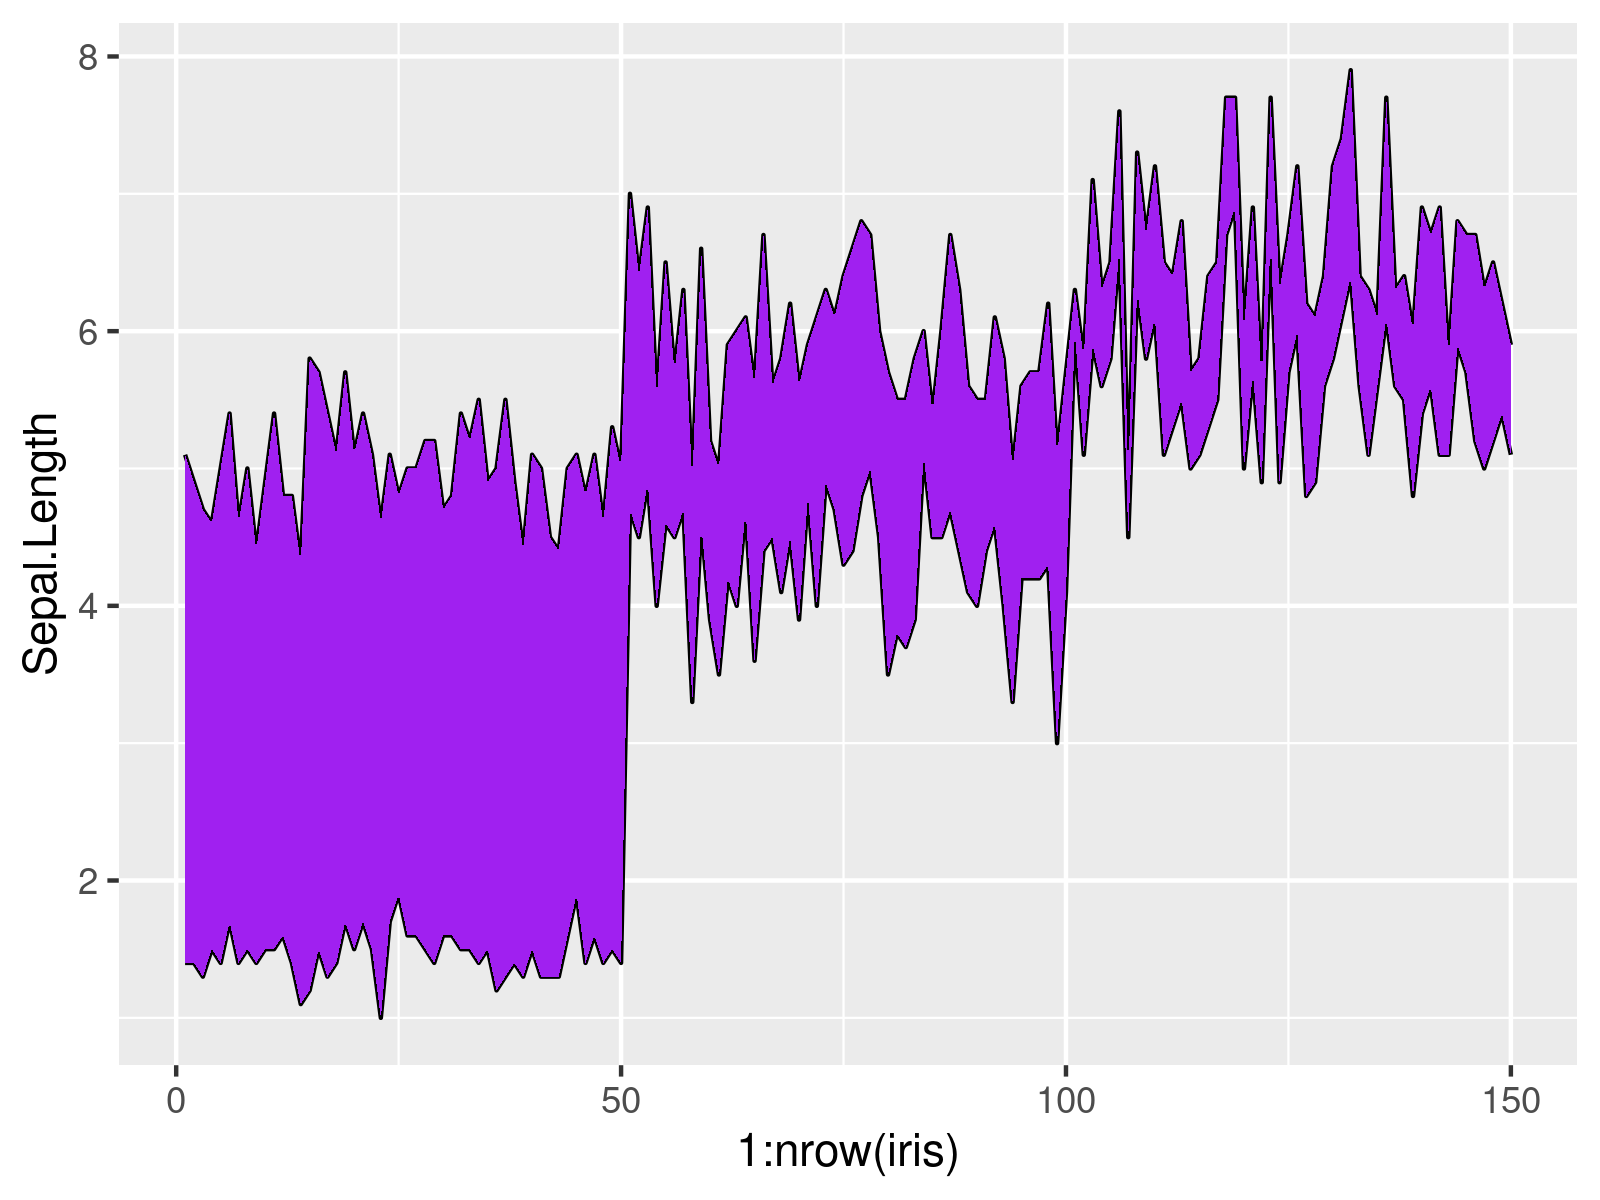
my_plot + # Adding color between multiple lines geom_ribbon(aes(x = 1:nrow(iris), ymin = Sepal.Length, ymax = Petal.Length), fill = "purple") |
my_plot + # Adding color between multiple lines geom_ribbon(aes(x = 1:nrow(iris), ymin = Sepal.Length, ymax = Petal.Length), fill = "purple")

Related Tutorials
Please have a look at the following R tutorials. They illustrate topics such as text elements, colors, and lines:
- How to Add a ggplot2 Title & Subtitle with Different Size & Color
- How to Add Text Outside of ggplot2 Plot Borders
- Get Fitted Values of Regression Line from ggplot2 Plot
- Change ggplot2 Plot Background Colors by Region
- ggplot2 Plot of Two Data Frames with Different Sizes
- How to Add Lines & Points to a ggplot2 Plot
