How to Add Lines & Points to a ggplot2 Plot in R (Example Code)
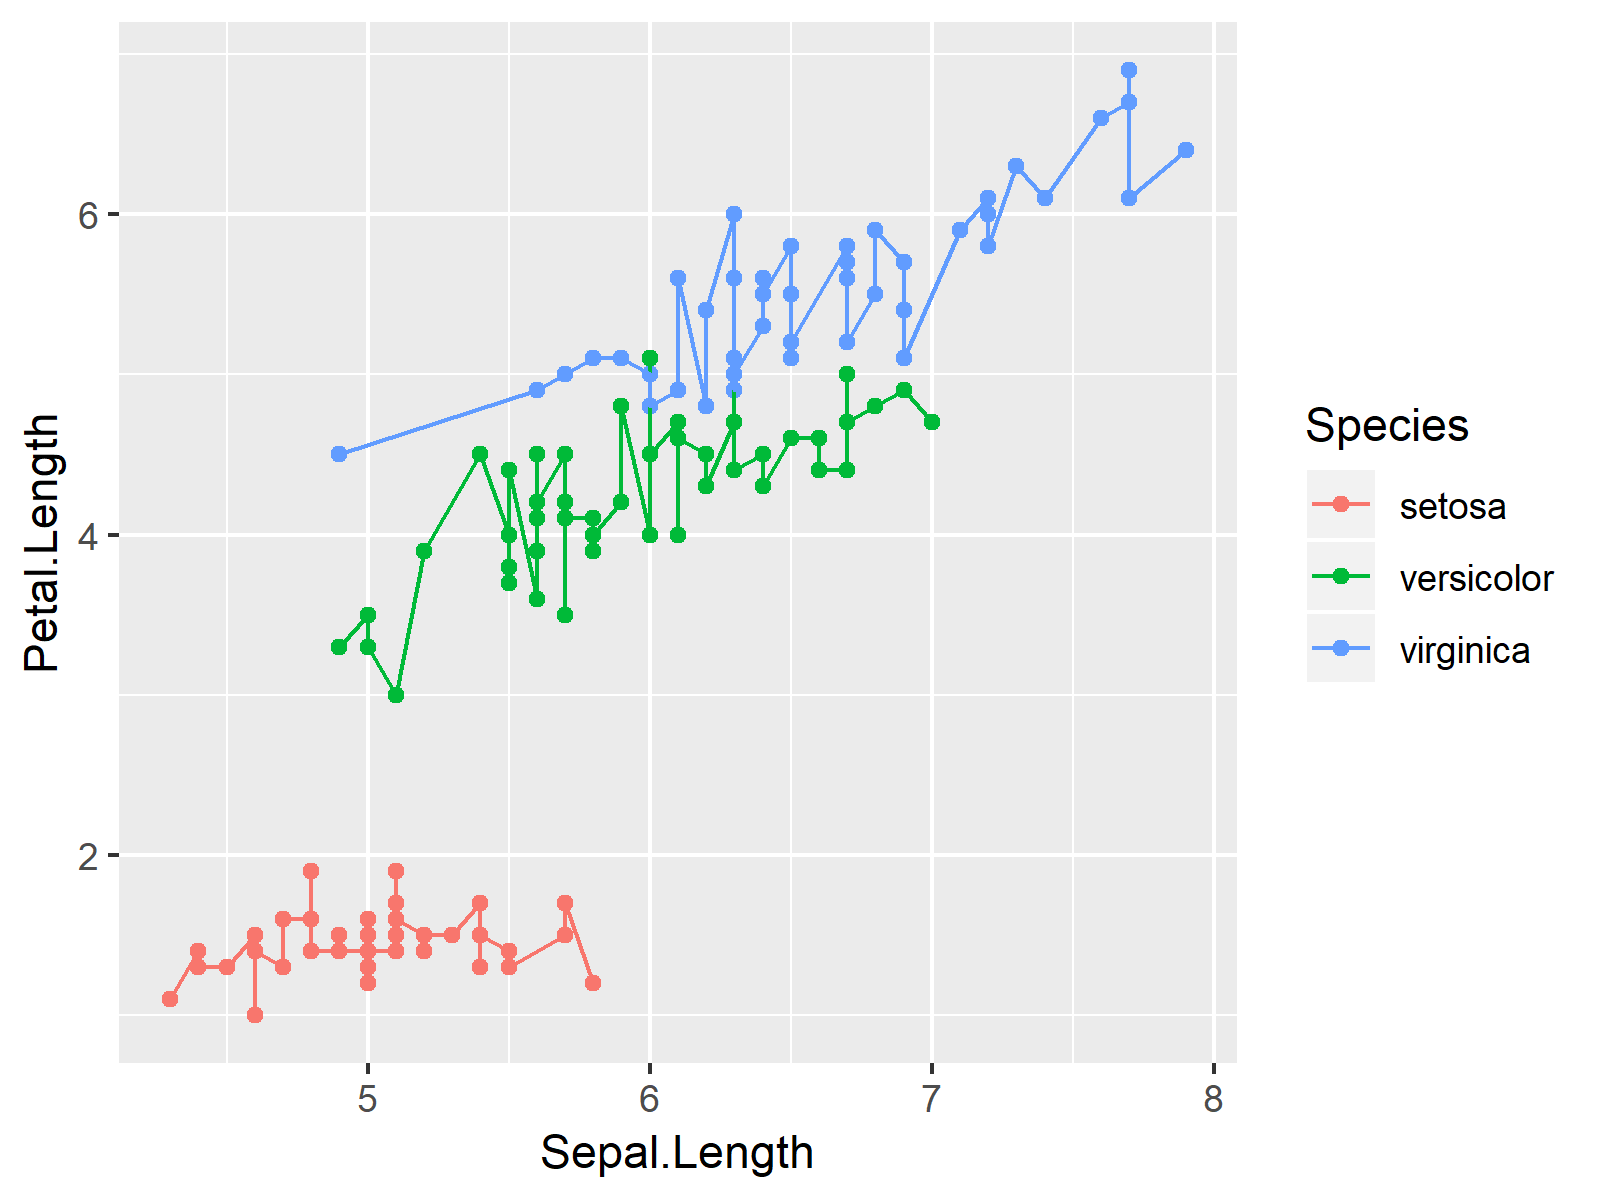
In this tutorial, I’ll illustrate how to draw a ggplot2 plot with points and lines in the R programming language.
Setting up the Example
data(iris) # Example data frame head(iris) # Head of example data # Sepal.Length Sepal.Width Petal.Length Petal.Width Species # 1 5.1 3.5 1.4 0.2 setosa # 2 4.9 3.0 1.4 0.2 setosa # 3 4.7 3.2 1.3 0.2 setosa # 4 4.6 3.1 1.5 0.2 setosa # 5 5.0 3.6 1.4 0.2 setosa # 6 5.4 3.9 1.7 0.4 setosa |
data(iris) # Example data frame head(iris) # Head of example data # Sepal.Length Sepal.Width Petal.Length Petal.Width Species # 1 5.1 3.5 1.4 0.2 setosa # 2 4.9 3.0 1.4 0.2 setosa # 3 4.7 3.2 1.3 0.2 setosa # 4 4.6 3.1 1.5 0.2 setosa # 5 5.0 3.6 1.4 0.2 setosa # 6 5.4 3.9 1.7 0.4 setosa
install.packages("ggplot2") # Install & load ggplot2 package library("ggplot2") |
install.packages("ggplot2") # Install & load ggplot2 package library("ggplot2")
Example: Drawing Lines & Points in ggplot2 Graphic
ggplot(iris, # Create ggplot2 graph aes(x = Sepal.Length, y = Petal.Length, col = Species)) + geom_point() + # Adding points geom_line() # Adding lines |
ggplot(iris, # Create ggplot2 graph aes(x = Sepal.Length, y = Petal.Length, col = Species)) + geom_point() + # Adding points geom_line() # Adding lines

Related Tutorials & Further Resources
In the following, you can find some further resources on topics such as variables, graphics in R, and ggplot2.
