Change ggplot2 Plot Background Colors by Region in R (Example Code)
In this R tutorial you’ll learn how to create a ggplot2 plot with different background colors.
Preparing the Example
data(iris) # Load example data head(iris) # Sepal.Length Sepal.Width Petal.Length Petal.Width Species # 1 5.1 3.5 1.4 0.2 setosa # 2 4.9 3.0 1.4 0.2 setosa # 3 4.7 3.2 1.3 0.2 setosa # 4 4.6 3.1 1.5 0.2 setosa # 5 5.0 3.6 1.4 0.2 setosa # 6 5.4 3.9 1.7 0.4 setosa |
data(iris) # Load example data head(iris) # Sepal.Length Sepal.Width Petal.Length Petal.Width Species # 1 5.1 3.5 1.4 0.2 setosa # 2 4.9 3.0 1.4 0.2 setosa # 3 4.7 3.2 1.3 0.2 setosa # 4 4.6 3.1 1.5 0.2 setosa # 5 5.0 3.6 1.4 0.2 setosa # 6 5.4 3.9 1.7 0.4 setosa
install.packages("ggplot2") # Install ggplot2 package library("ggplot2") # Load ggplot2 package |
install.packages("ggplot2") # Install ggplot2 package library("ggplot2") # Load ggplot2 package
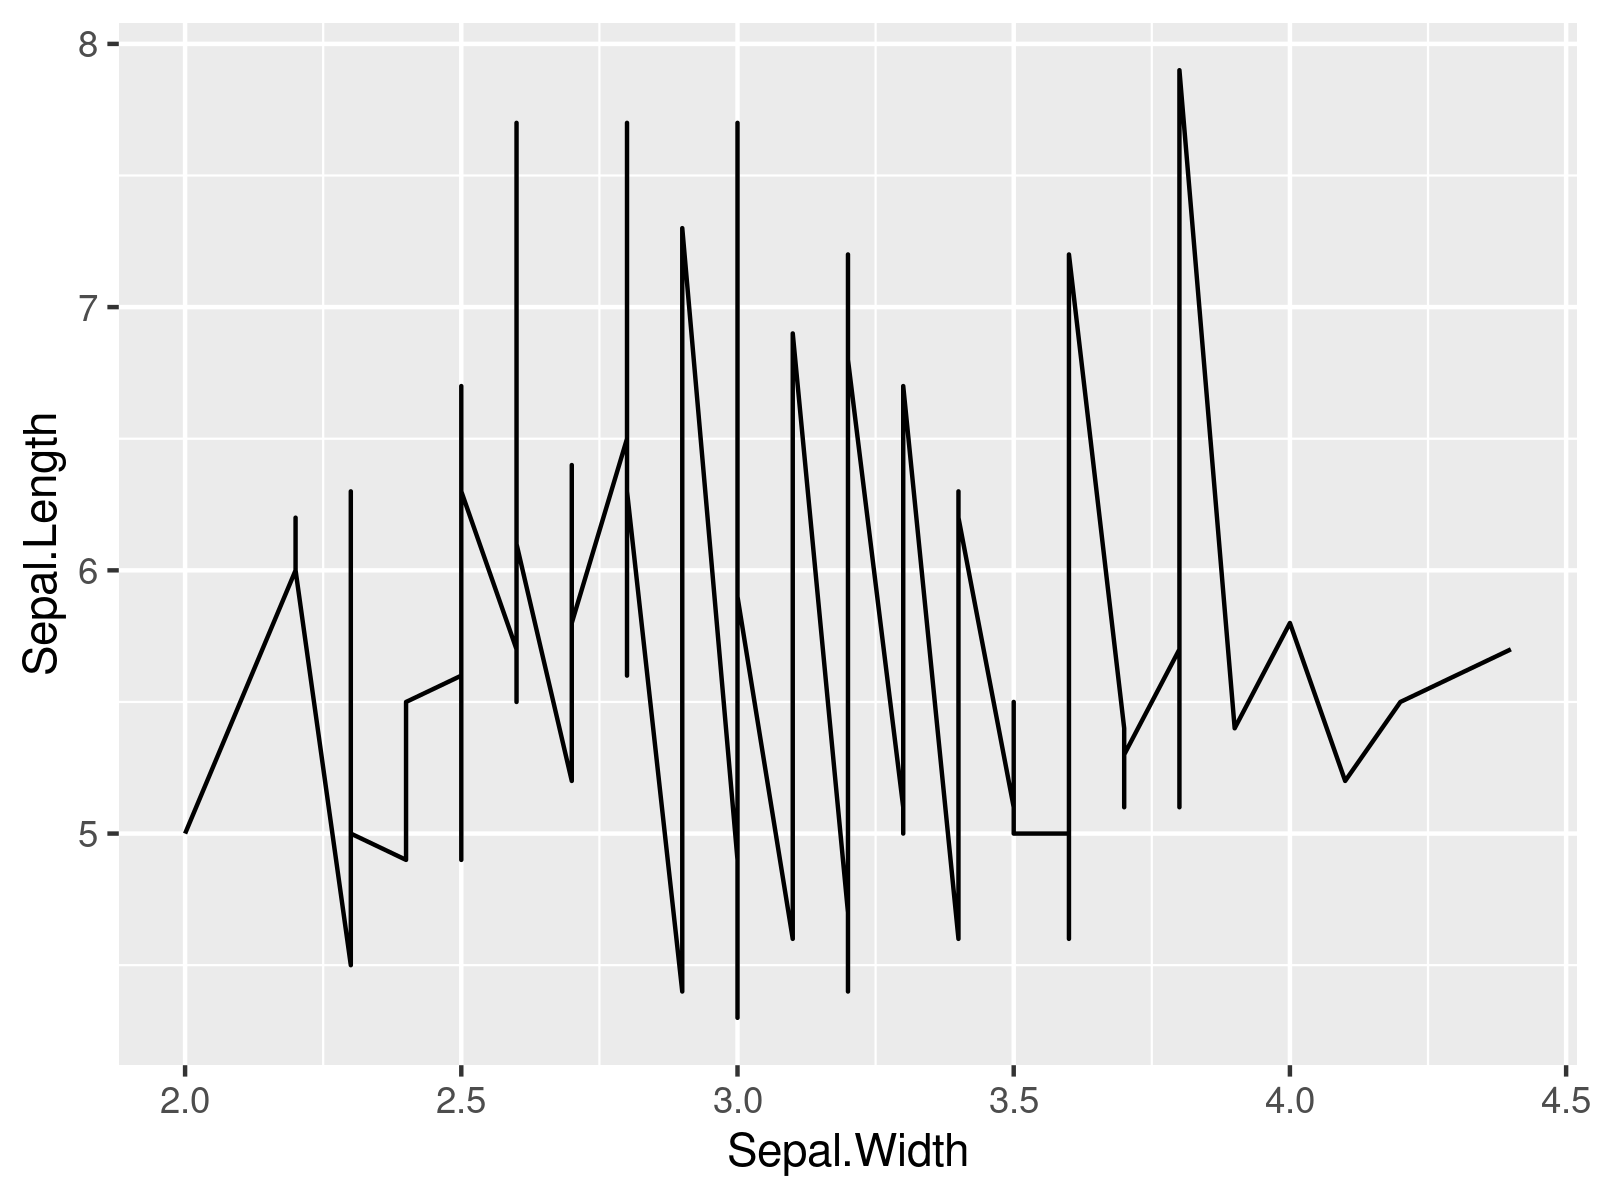
ggplot(iris, # Create ggplot2 plot without colors aes(x = Sepal.Width, y = Sepal.Length)) + geom_line() |
ggplot(iris, # Create ggplot2 plot without colors aes(x = Sepal.Width, y = Sepal.Length)) + geom_line()

Example: Draw ggplot2 Graphic with Multiple Background Colors
iris_colors <- data.frame(min = 1:3, # Create data with breaks max = 2:4, fillings = letters[1:3]) # min max fillings # 1 1 2 a # 2 2 3 b # 3 3 4 c iris_colors # Print data with breaks |
iris_colors <- data.frame(min = 1:3, # Create data with breaks max = 2:4, fillings = letters[1:3]) # min max fillings # 1 1 2 a # 2 2 3 b # 3 3 4 c iris_colors # Print data with breaks
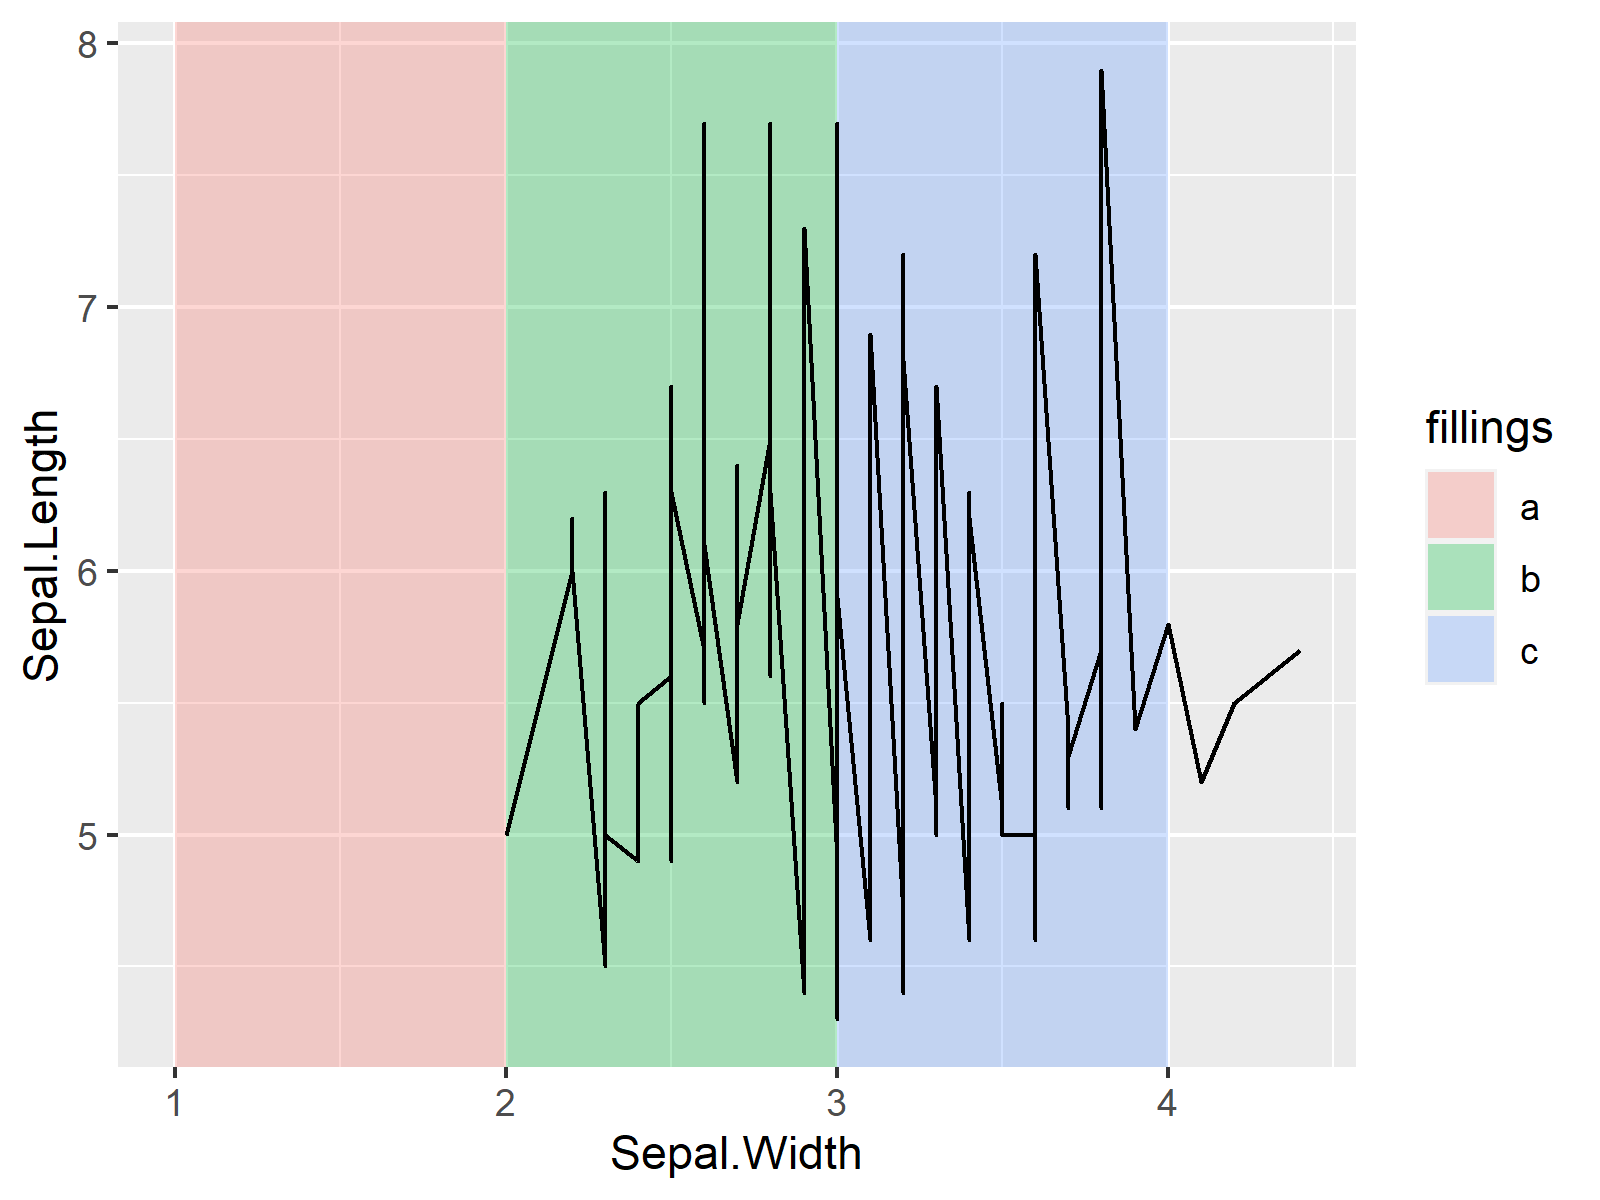
ggplot() + # ggplot2 graphic with background colors geom_rect(data = iris_colors, aes(xmin = min, xmax = max, ymin = - Inf, ymax = Inf, fill = fillings), alpha = 0.3) + geom_point(data = iris, aes(x = Sepal.Width, y = Sepal.Length)) |
ggplot() + # ggplot2 graphic with background colors geom_rect(data = iris_colors, aes(xmin = min, xmax = max, ymin = - Inf, ymax = Inf, fill = fillings), alpha = 0.3) + geom_point(data = iris, aes(x = Sepal.Width, y = Sepal.Length))

Further Resources
In the following, you may find some additional resources on topics such as plot legends, variables, graphics in R, and ggplot2:
