How to Add a ggplot2 Title & Subtitle with Different Size & Color in R (Example Code)
This tutorial illustrates how to change size and color of ggplot2 titles in the R programming language.
Preparing the Example
my_df <- data.frame(x = 1:5, # Example data y = c(2, 1, 4, 2, 3)) |
my_df <- data.frame(x = 1:5, # Example data y = c(2, 1, 4, 2, 3))
install.packages("ggplot2") # Install & load ggplot2 package library("ggplot2") |
install.packages("ggplot2") # Install & load ggplot2 package library("ggplot2")
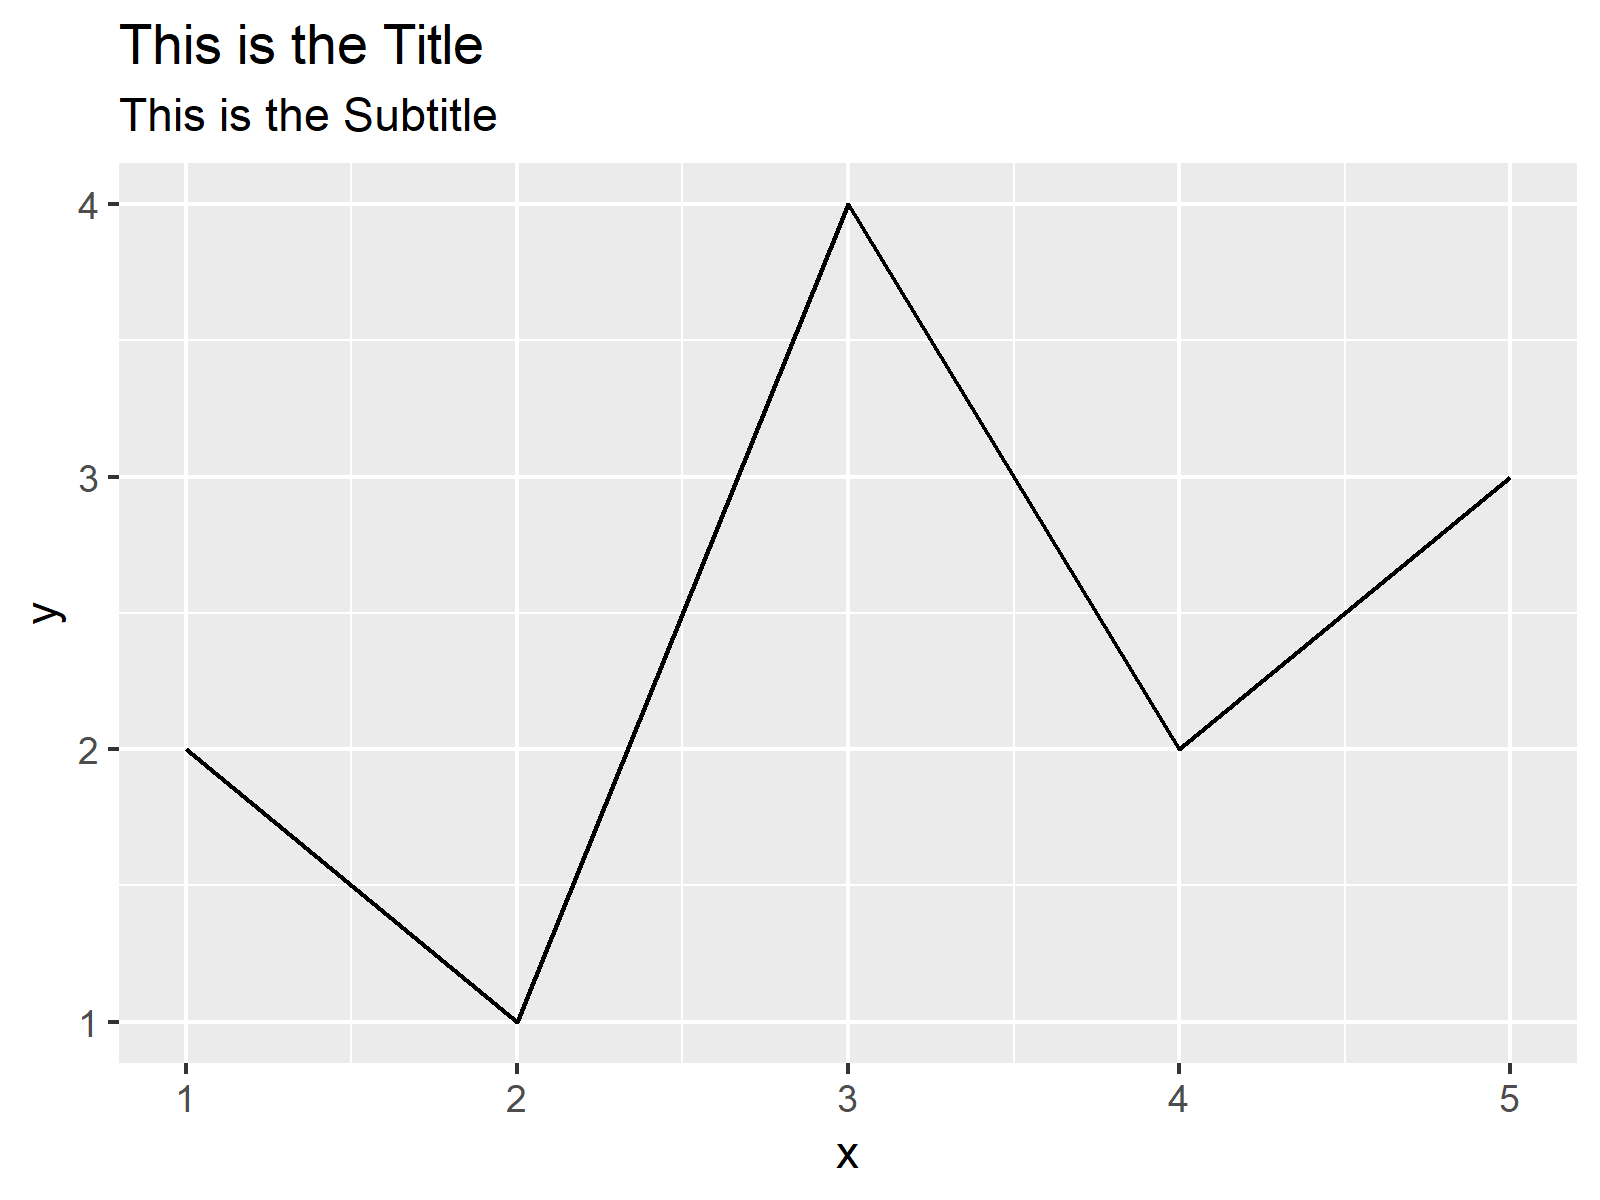
my_ggp <- ggplot(my_df, aes(x, y)) + # ggplot2 plot with default titles geom_line() + labs(title = "This is the Title", subtitle = "This is the Subtitle") my_ggp # Draw plot |
my_ggp <- ggplot(my_df, aes(x, y)) + # ggplot2 plot with default titles geom_line() + labs(title = "This is the Title", subtitle = "This is the Subtitle") my_ggp # Draw plot

Example: Modify Size & Color of ggplot2 Title & Subtitle
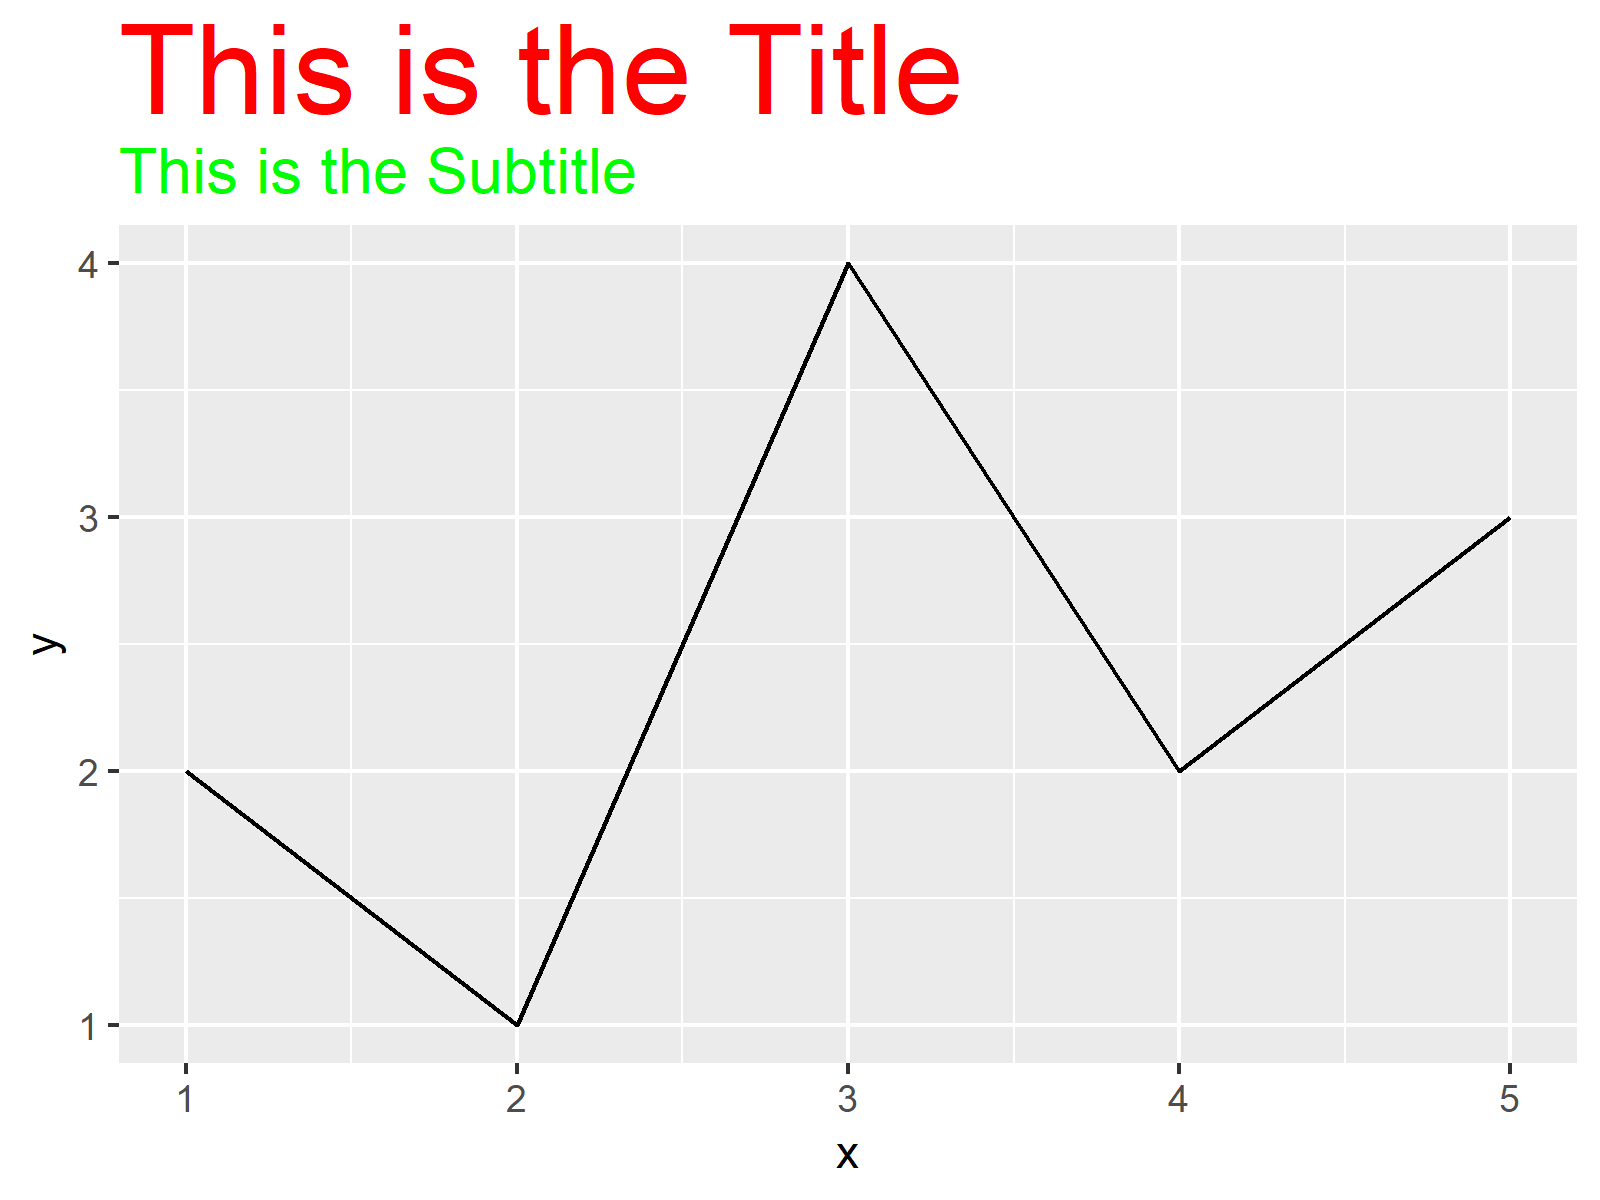
my_ggp + # Change colors & size theme(plot.title = element_text(size = 30, color = "red"), plot.subtitle = element_text(size = 15, color = "green")) |
my_ggp + # Change colors & size theme(plot.title = element_text(size = 30, color = "red"), plot.subtitle = element_text(size = 15, color = "green"))

