How to Add Text Outside of ggplot2 Plot Borders in R (Example Code)
In this tutorial, I’ll illustrate how to annotate a character string outside of a ggplot2 plot in the R programming language.
Preparing the Example
data(iris) # Loading data head(iris) # Sepal.Length Sepal.Width Petal.Length Petal.Width Species # 1 5.1 3.5 1.4 0.2 setosa # 2 4.9 3.0 1.4 0.2 setosa # 3 4.7 3.2 1.3 0.2 setosa # 4 4.6 3.1 1.5 0.2 setosa # 5 5.0 3.6 1.4 0.2 setosa # 6 5.4 3.9 1.7 0.4 setosa |
data(iris) # Loading data head(iris) # Sepal.Length Sepal.Width Petal.Length Petal.Width Species # 1 5.1 3.5 1.4 0.2 setosa # 2 4.9 3.0 1.4 0.2 setosa # 3 4.7 3.2 1.3 0.2 setosa # 4 4.6 3.1 1.5 0.2 setosa # 5 5.0 3.6 1.4 0.2 setosa # 6 5.4 3.9 1.7 0.4 setosa
install.packages("ggplot2") # Install & load ggplot2 library("ggplot2") |
install.packages("ggplot2") # Install & load ggplot2 library("ggplot2")
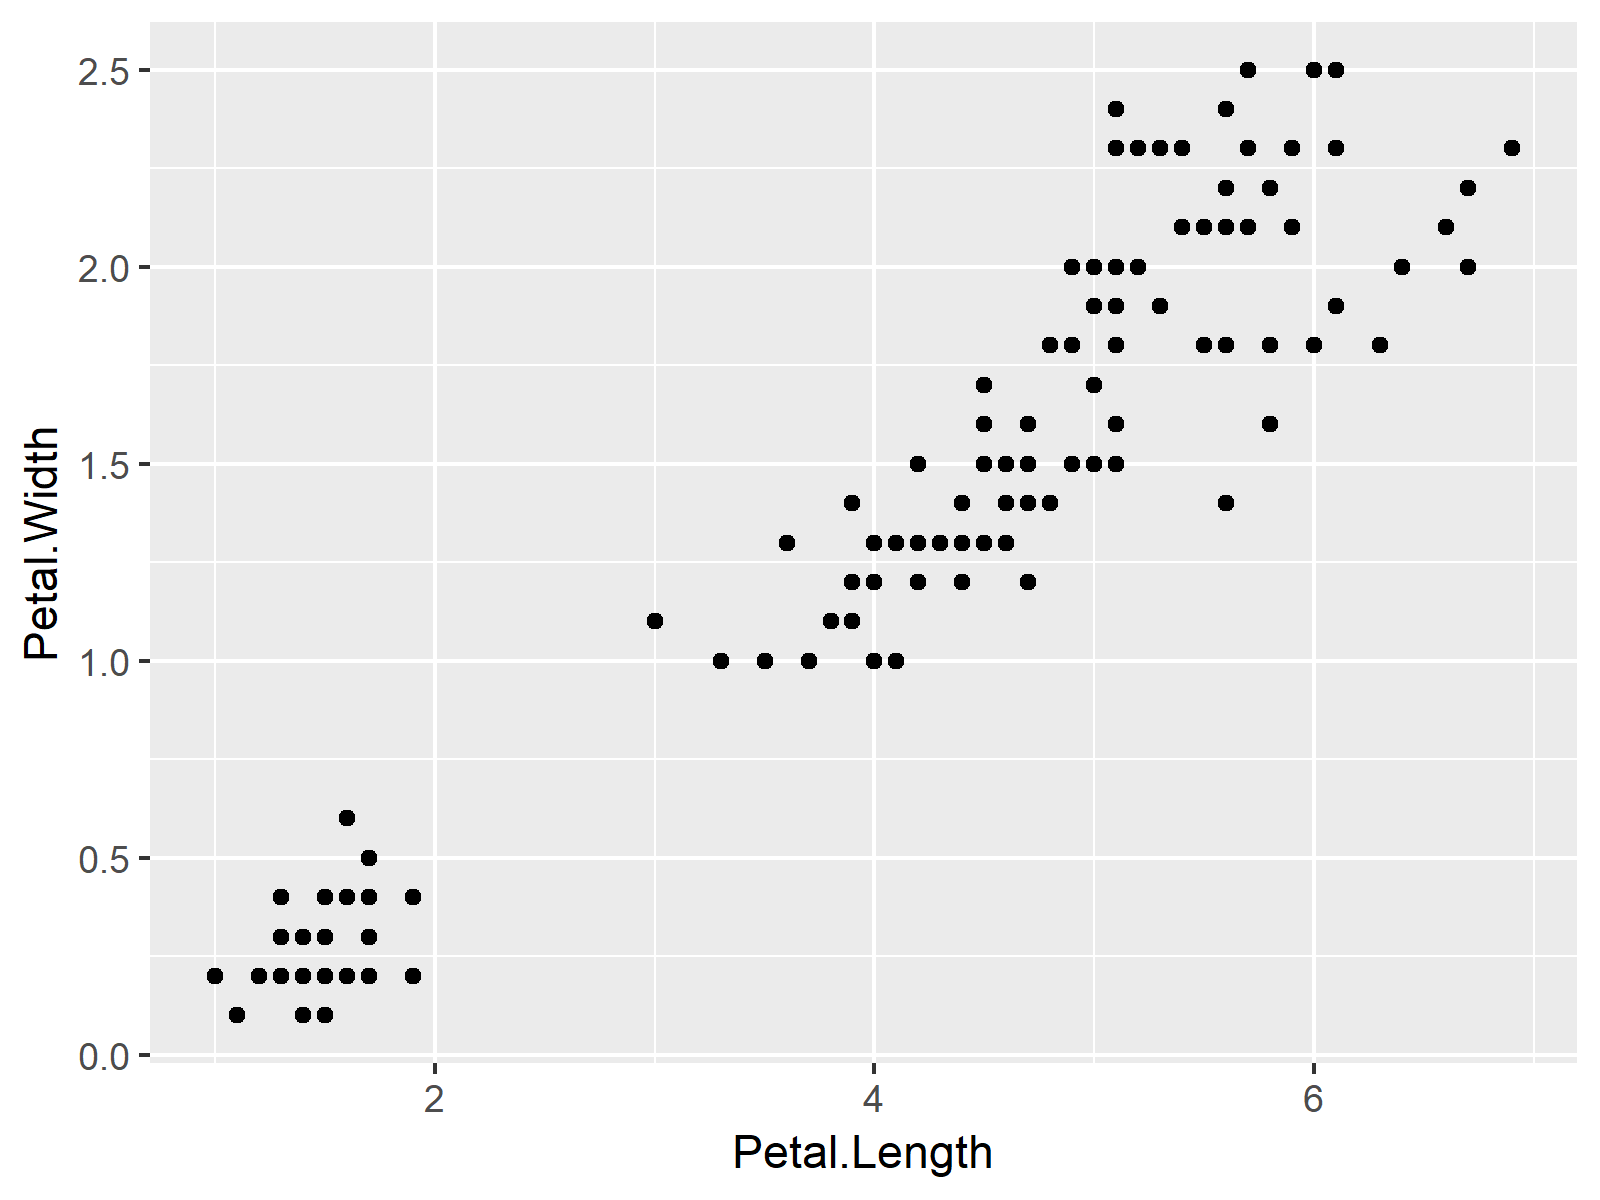
my_plot <- ggplot(iris, # Creating default ggplot2 plot aes(Petal.Length, Petal.Width, label = "some text")) + geom_point() + geom_text(x = 0, size = 5) # Trying to add text my_plot # ggplot2 plot does not show text |
my_plot <- ggplot(iris, # Creating default ggplot2 plot aes(Petal.Length, Petal.Width, label = "some text")) + geom_point() + geom_text(x = 0, size = 5) # Trying to add text my_plot # ggplot2 plot does not show text

Example: Change Plot Margins & Allow Text Outside of Graphic Borders
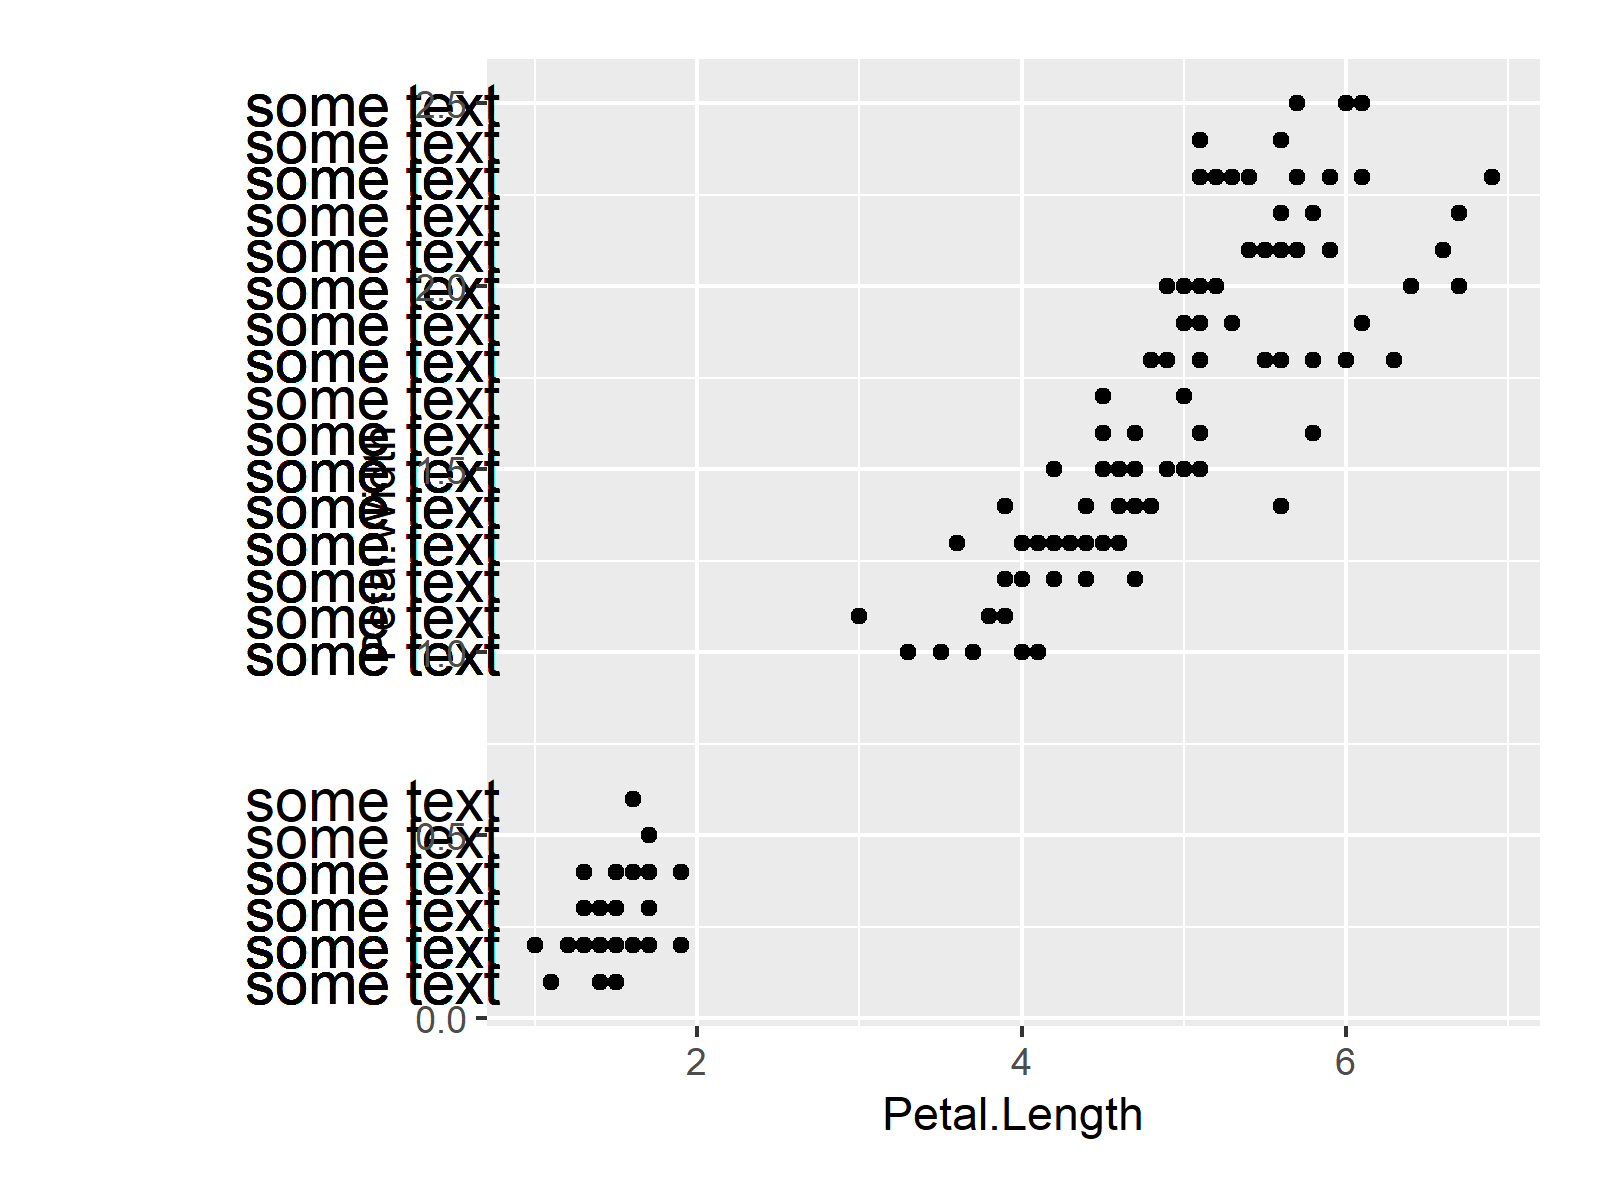
my_plot + # Adding text theme(plot.margin = unit(c(1, 1, 1, 6), "lines")) + coord_cartesian(clip = "off") |
my_plot + # Adding text theme(plot.margin = unit(c(1, 1, 1, 6), "lines")) + coord_cartesian(clip = "off")

