How to Overlay Multiple Densities in Same Graphic in Base R (Example Code)
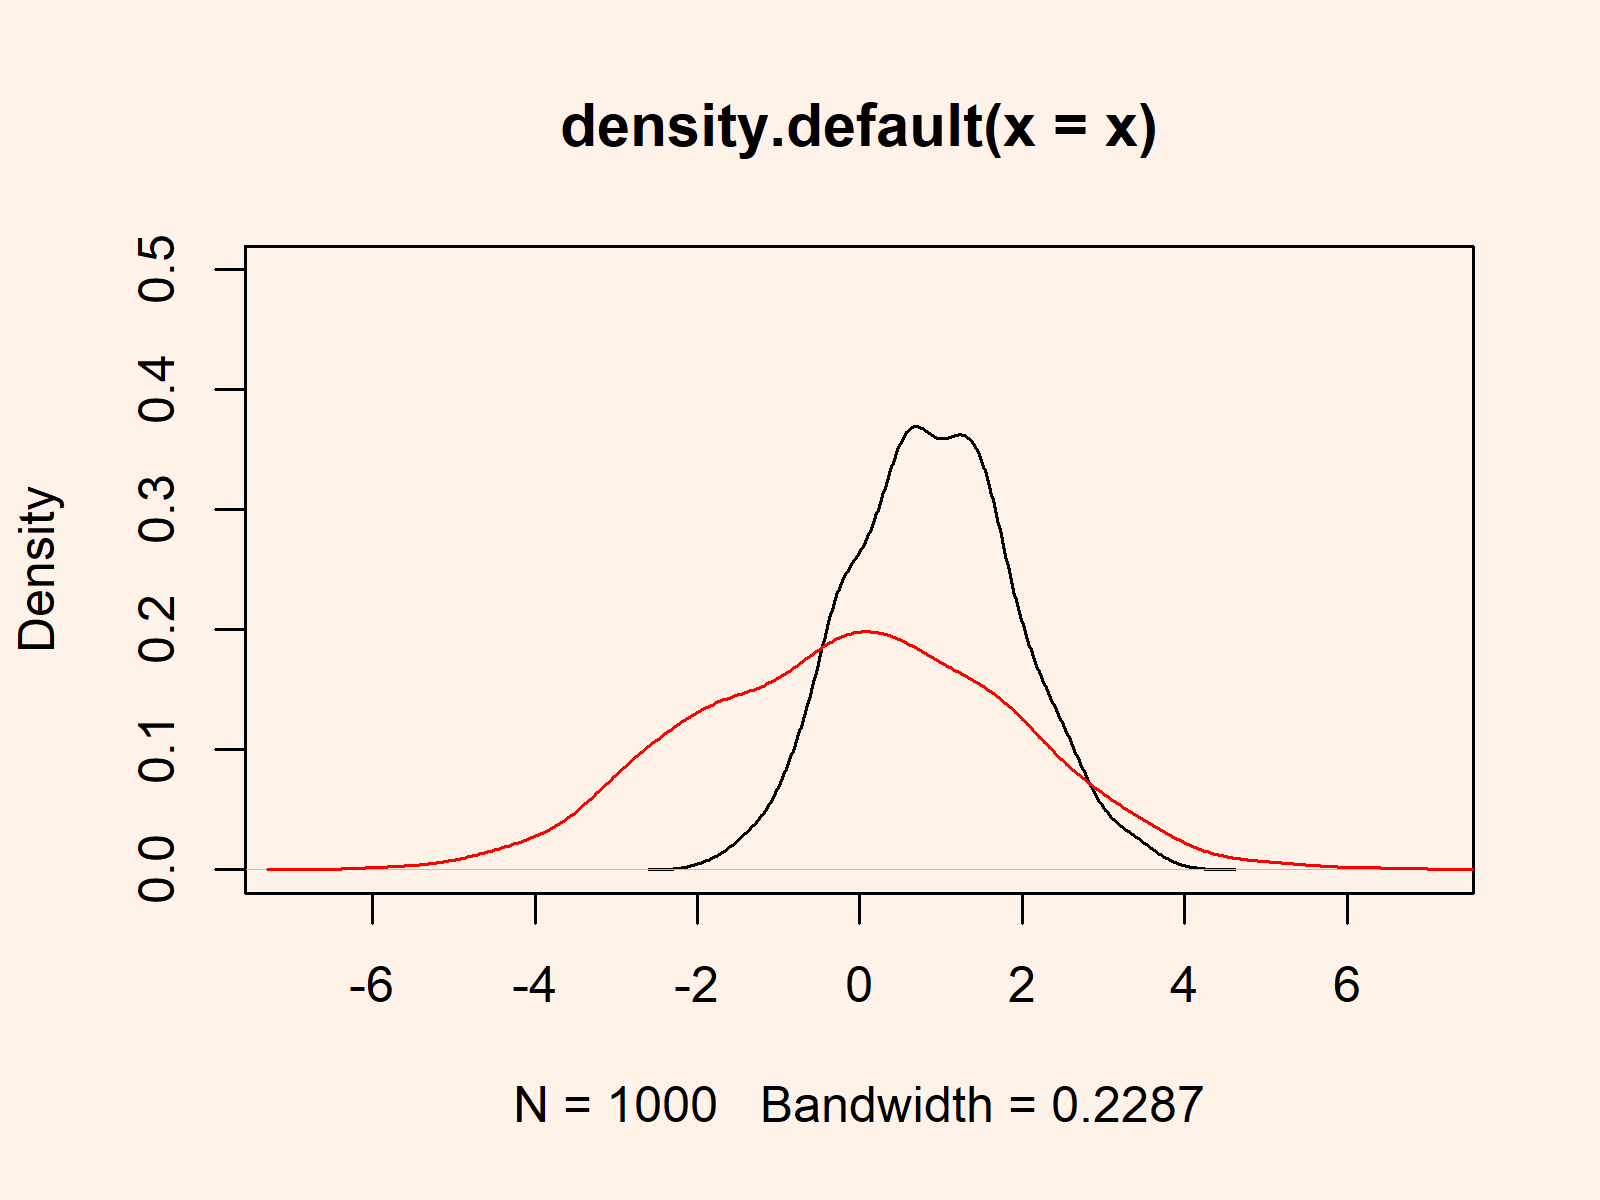
In this R article you’ll learn how to overlay multiple density plots.
Constructing Example Data
set.seed(345243) # Set seed x <- rnorm(1000, 1) # Create numeric vectors for densities y <- rnorm(1000, 0, 2) |
set.seed(345243) # Set seed x <- rnorm(1000, 1) # Create numeric vectors for densities y <- rnorm(1000, 0, 2)
Example: Overlay Multiple Densities in R
plot(density(x), # Plot density of x # Plot first density xlim = c(- 7, 7), ylim = c(0, 0.5)) lines(density(y), # Overlay second density col = 2) |
plot(density(x), # Plot density of x # Plot first density xlim = c(- 7, 7), ylim = c(0, 0.5)) lines(density(y), # Overlay second density col = 2)

