Draw Diagonal Line to Base R & ggplot2 Plot (2 Examples)
This article shows how to overlay a diagonal line to a plot in the R programming language.
Creation of Example Data
data(iris) # Importing example data head(iris) # Sepal.Length Sepal.Width Petal.Length Petal.Width Species # 1 5.1 3.5 1.4 0.2 setosa # 2 4.9 3.0 1.4 0.2 setosa # 3 4.7 3.2 1.3 0.2 setosa # 4 4.6 3.1 1.5 0.2 setosa # 5 5.0 3.6 1.4 0.2 setosa # 6 5.4 3.9 1.7 0.4 setosa |
data(iris) # Importing example data head(iris) # Sepal.Length Sepal.Width Petal.Length Petal.Width Species # 1 5.1 3.5 1.4 0.2 setosa # 2 4.9 3.0 1.4 0.2 setosa # 3 4.7 3.2 1.3 0.2 setosa # 4 4.6 3.1 1.5 0.2 setosa # 5 5.0 3.6 1.4 0.2 setosa # 6 5.4 3.9 1.7 0.4 setosa
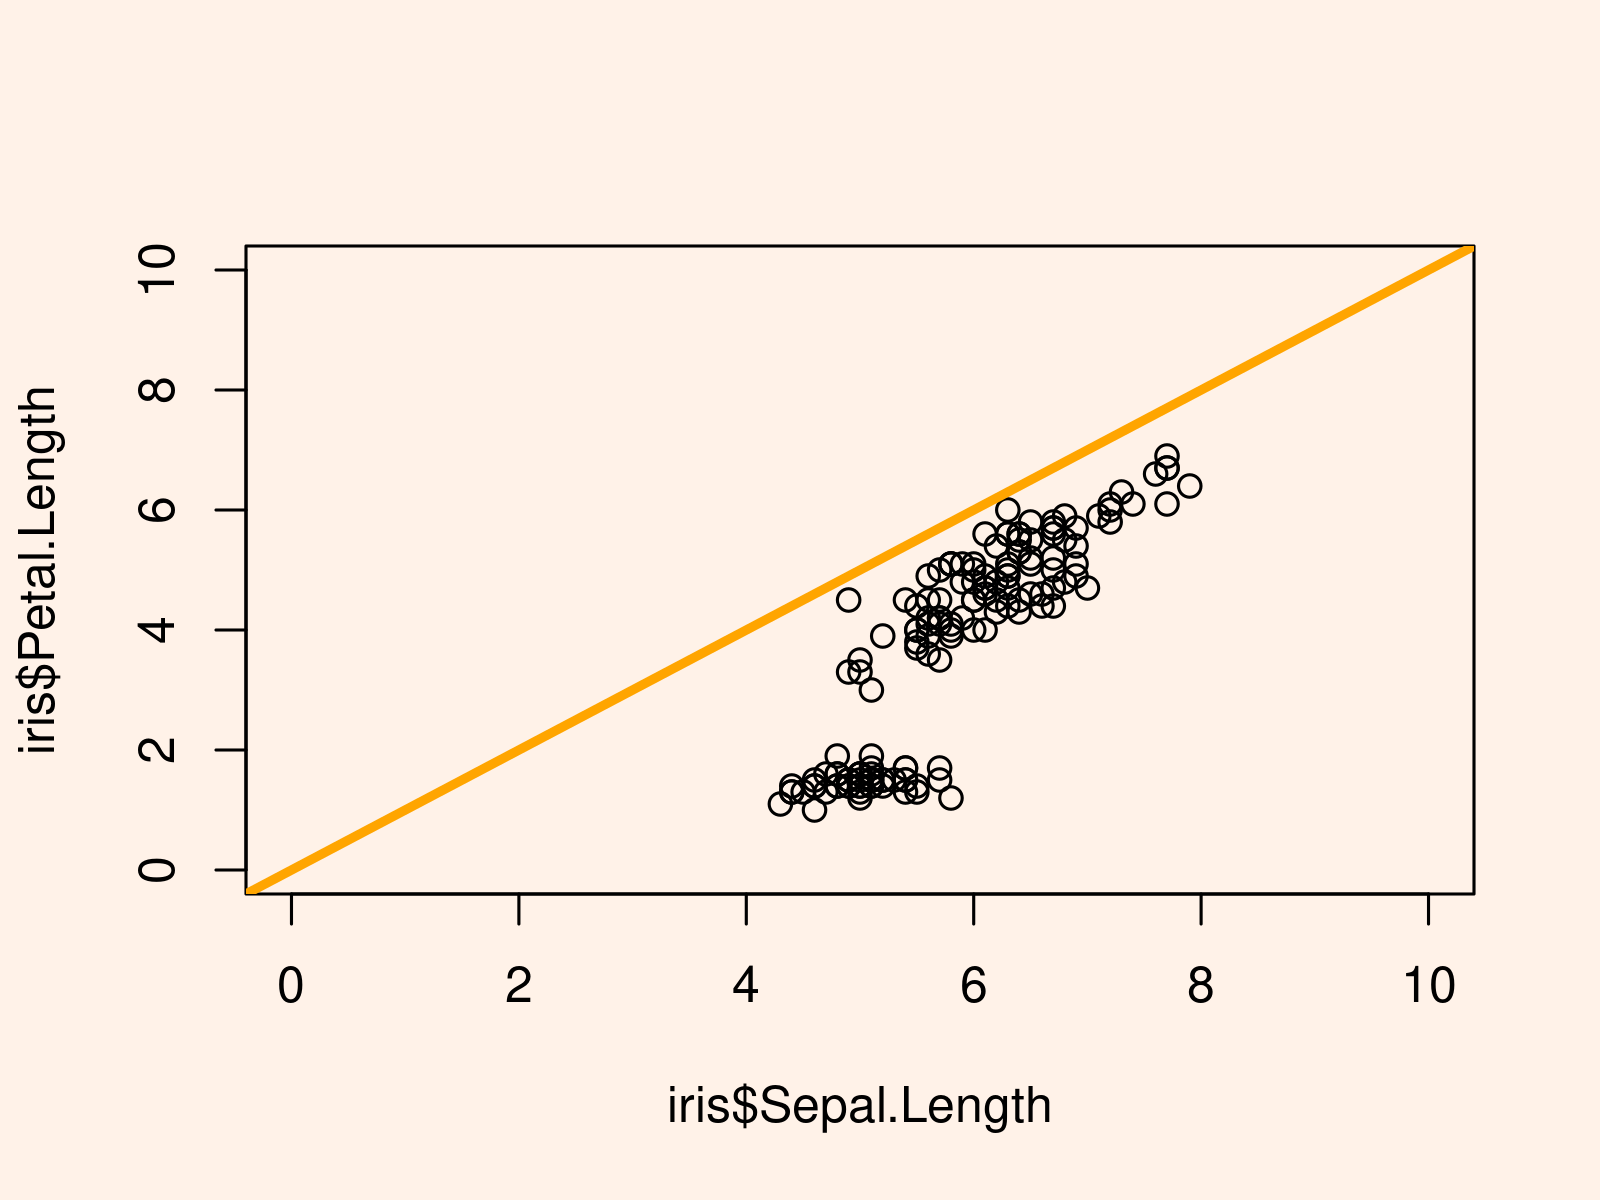
Example 1: Overlay Base R Plot with Diagonal Line
plot(iris$Sepal.Length, # Draw Base R plot with diagonal line iris$Petal.Length, xlim = c(0, 10), ylim = c(0, 10)) abline(coef = c(0, 1), lwd = 3, col = "orange") |
plot(iris$Sepal.Length, # Draw Base R plot with diagonal line iris$Petal.Length, xlim = c(0, 10), ylim = c(0, 10)) abline(coef = c(0, 1), lwd = 3, col = "orange")

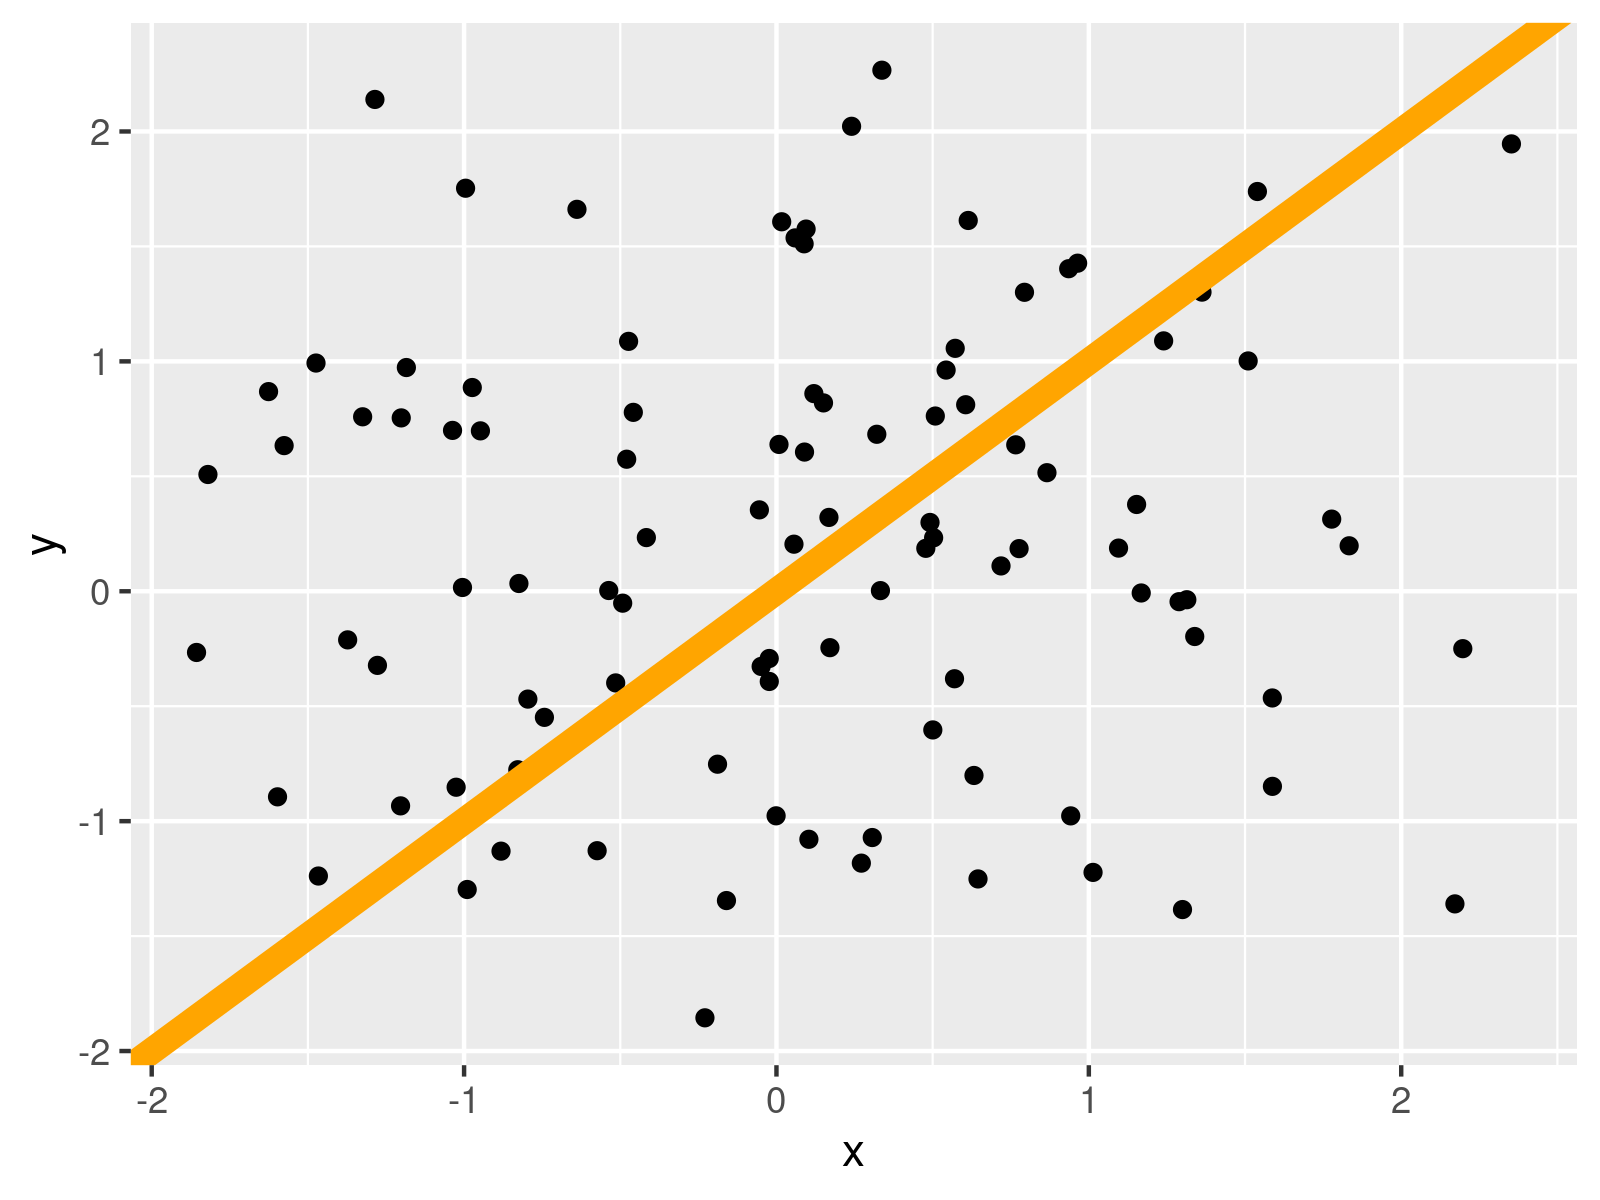
Example 2: Overlay ggplot2 Plot with Diagonal Line
install.packages("ggplot2") # Install & load ggplot2 package library("ggplot2") |
install.packages("ggplot2") # Install & load ggplot2 package library("ggplot2")
ggplot(data, aes(x, y)) + # Draw ggplot2 plot with diagonal line geom_point() + geom_abline(intercept = 0, slope = 1, size = 3, col = "orange") |
ggplot(data, aes(x, y)) + # Draw ggplot2 plot with diagonal line geom_point() + geom_abline(intercept = 0, slope = 1, size = 3, col = "orange")

Related Articles & Further Resources
Have a look at the following R tutorials. They focus on topics such as graphics in R, lines, ggplot2, and regression models.
