Draw Line Segment to Plot in Base R (Example) | segments Function
This article explains how to add a line segment to a plot with the segments() function in the R programming language.
Example Data & Basic Plot in R
Example data:
set.seed(159) # Create random data x <- rnorm(100) y <- x + rnorm(100) |
set.seed(159) # Create random data x <- rnorm(100) y <- x + rnorm(100)
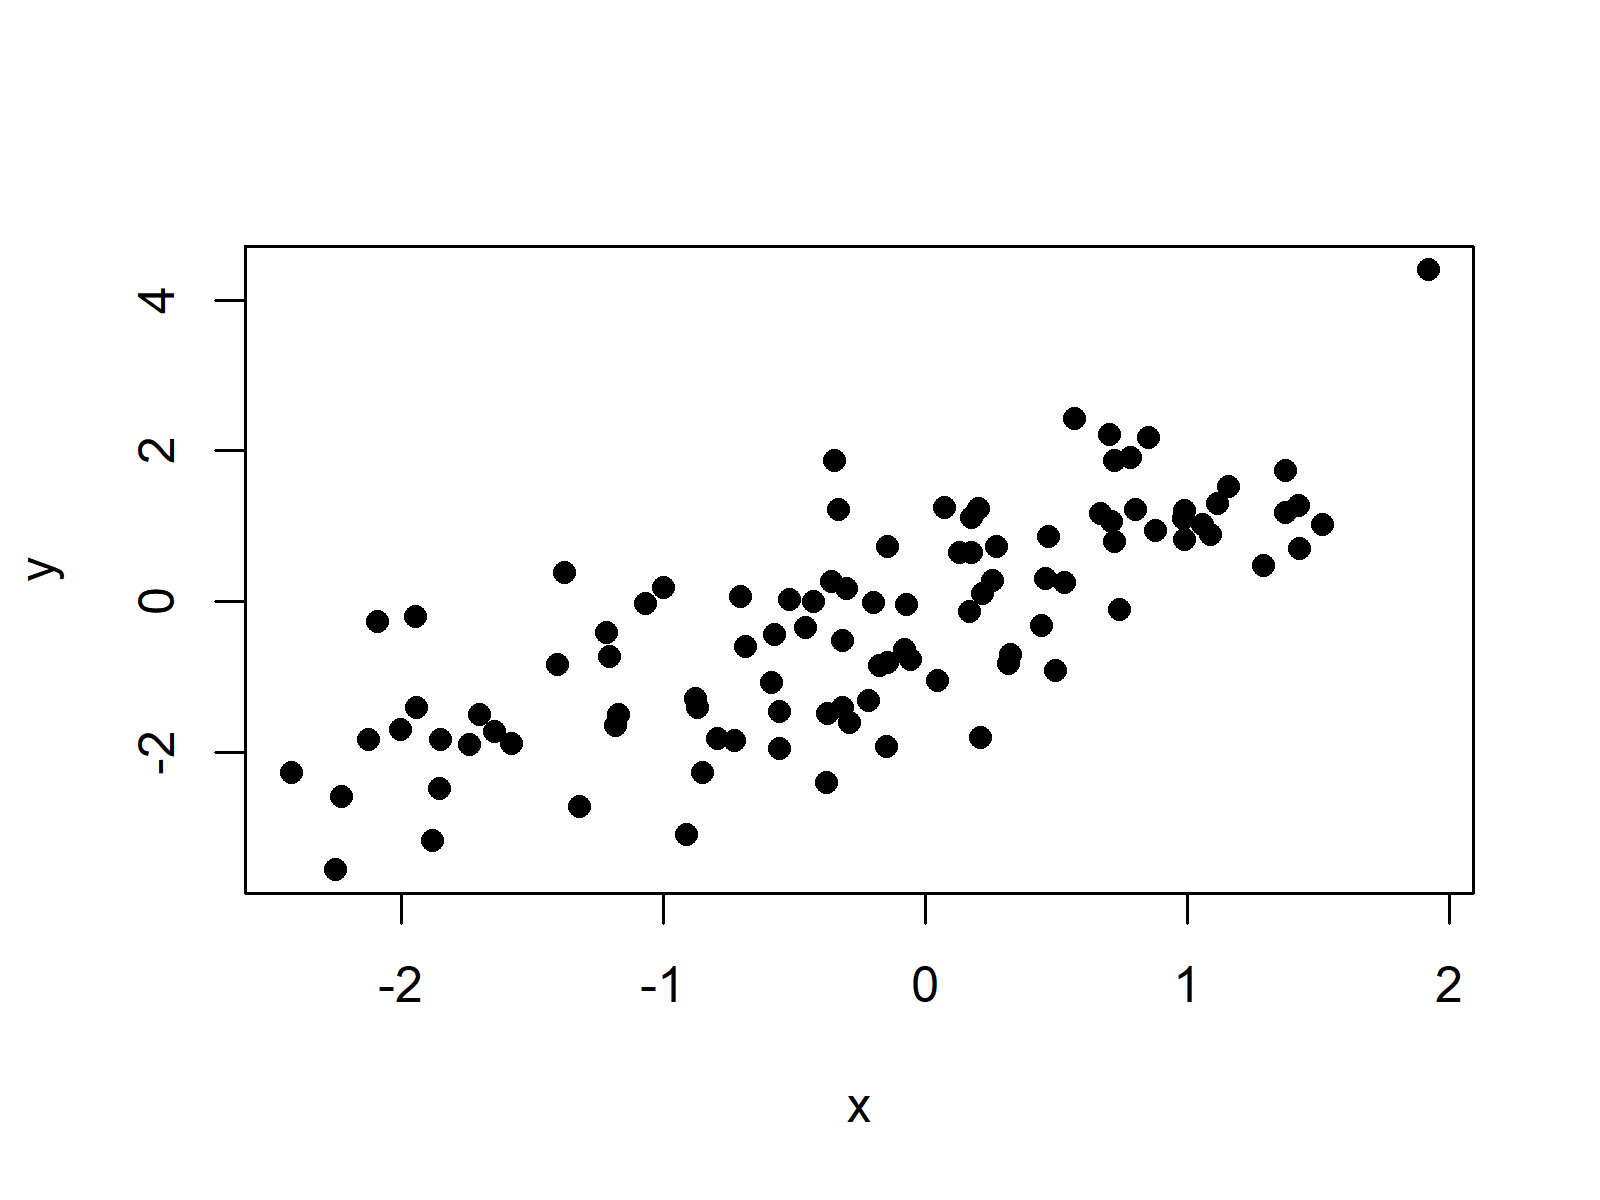
Draw basic plot:
plot(x, y, pch = 16) # Draw basic plot in R |
plot(x, y, pch = 16) # Draw basic plot in R

Add Line Segment to Plot (segments Function)
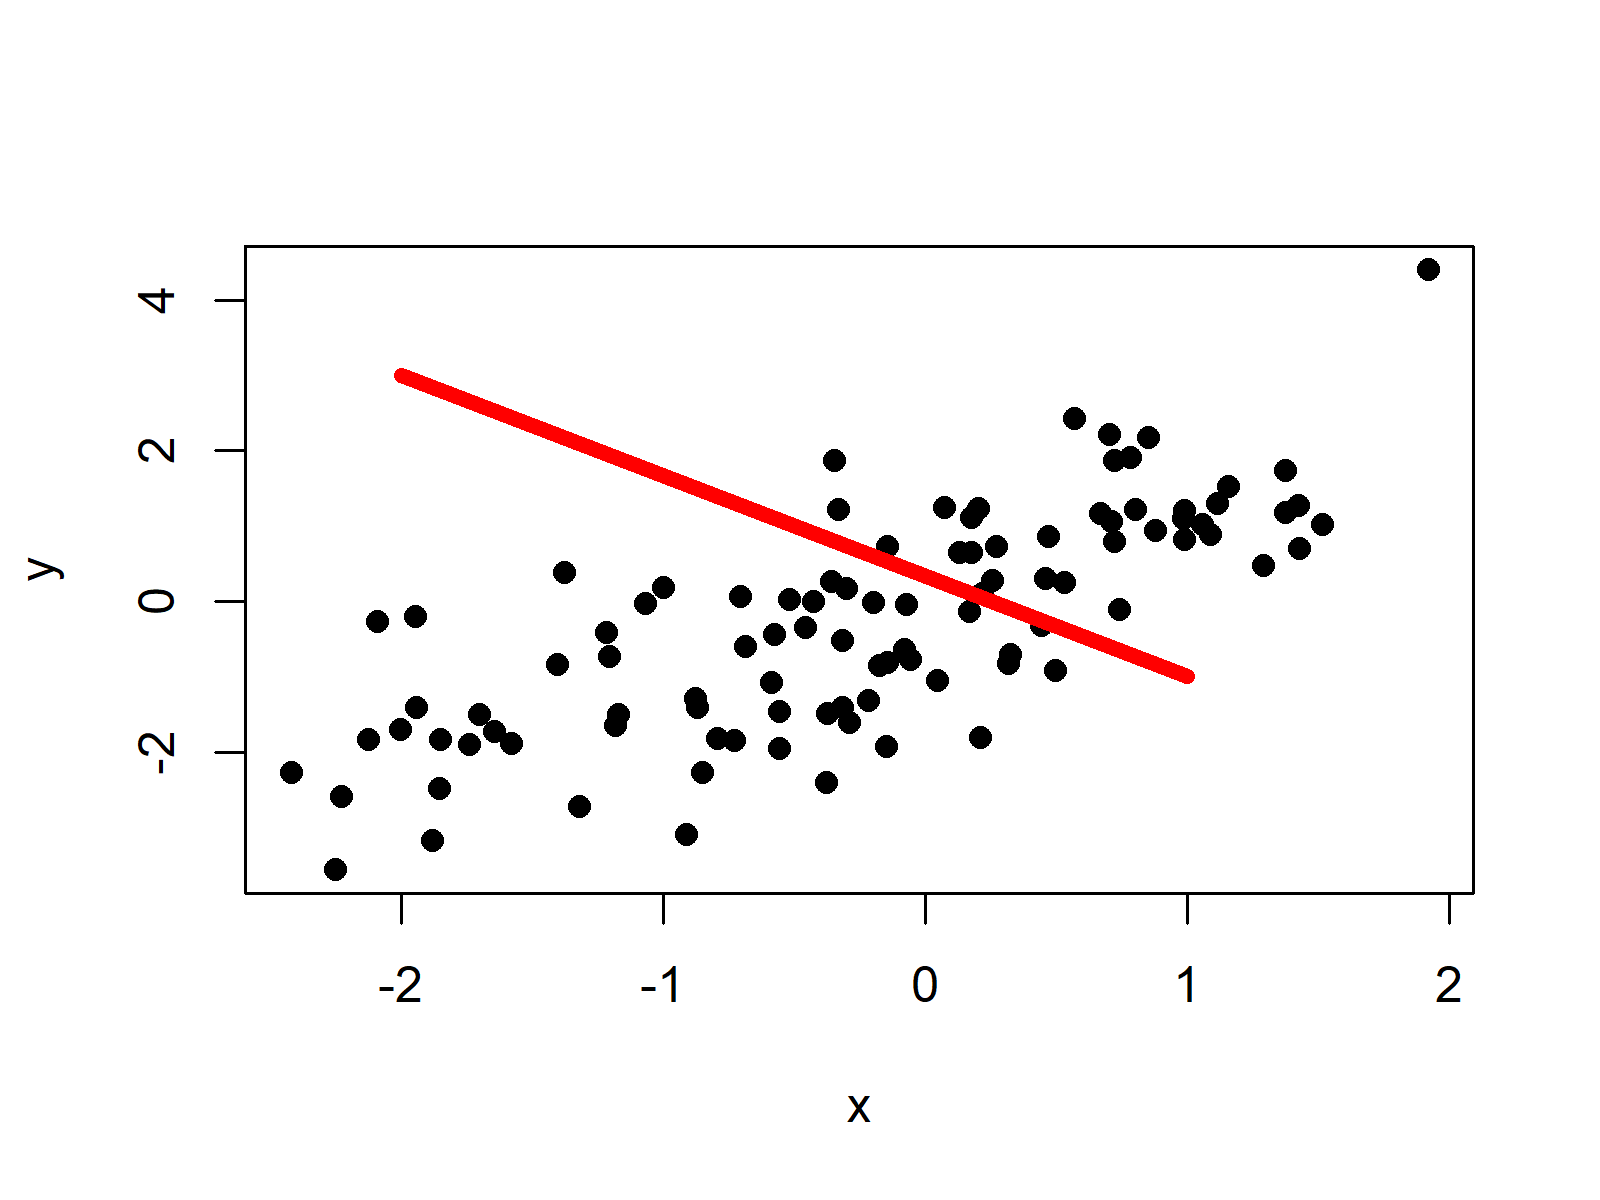
We can use the segments function to draw a line segment to our previously created plot:
segments(x0 = -2, y0 = 3, # Coordinates of starting point x1 = 1, y1 = -1, # Coordinates of finishing point col = "red", # Color of line lwd = 5) # Thickness of line |
segments(x0 = -2, y0 = 3, # Coordinates of starting point x1 = 1, y1 = -1, # Coordinates of finishing point col = "red", # Color of line lwd = 5) # Thickness of line

