ggplot2 R Warning – geom_path Each Group One Observation (2 Examples)
In this R programming tutorial you’ll learn how to handle the warning message “geom_path: Each group consists of only one observation. Do you need to adjust the group aesthetic?”.
Setting up the Examples
data(iris) # Loading example data in R iris_new <- iris[c(1, 51, 101), c(1, 5)] # Modify example data iris_new # Show example data # Sepal.Length Species # 1 5.1 setosa # 51 7.0 versicolor # 101 6.3 virginica |
data(iris) # Loading example data in R iris_new <- iris[c(1, 51, 101), c(1, 5)] # Modify example data iris_new # Show example data # Sepal.Length Species # 1 5.1 setosa # 51 7.0 versicolor # 101 6.3 virginica
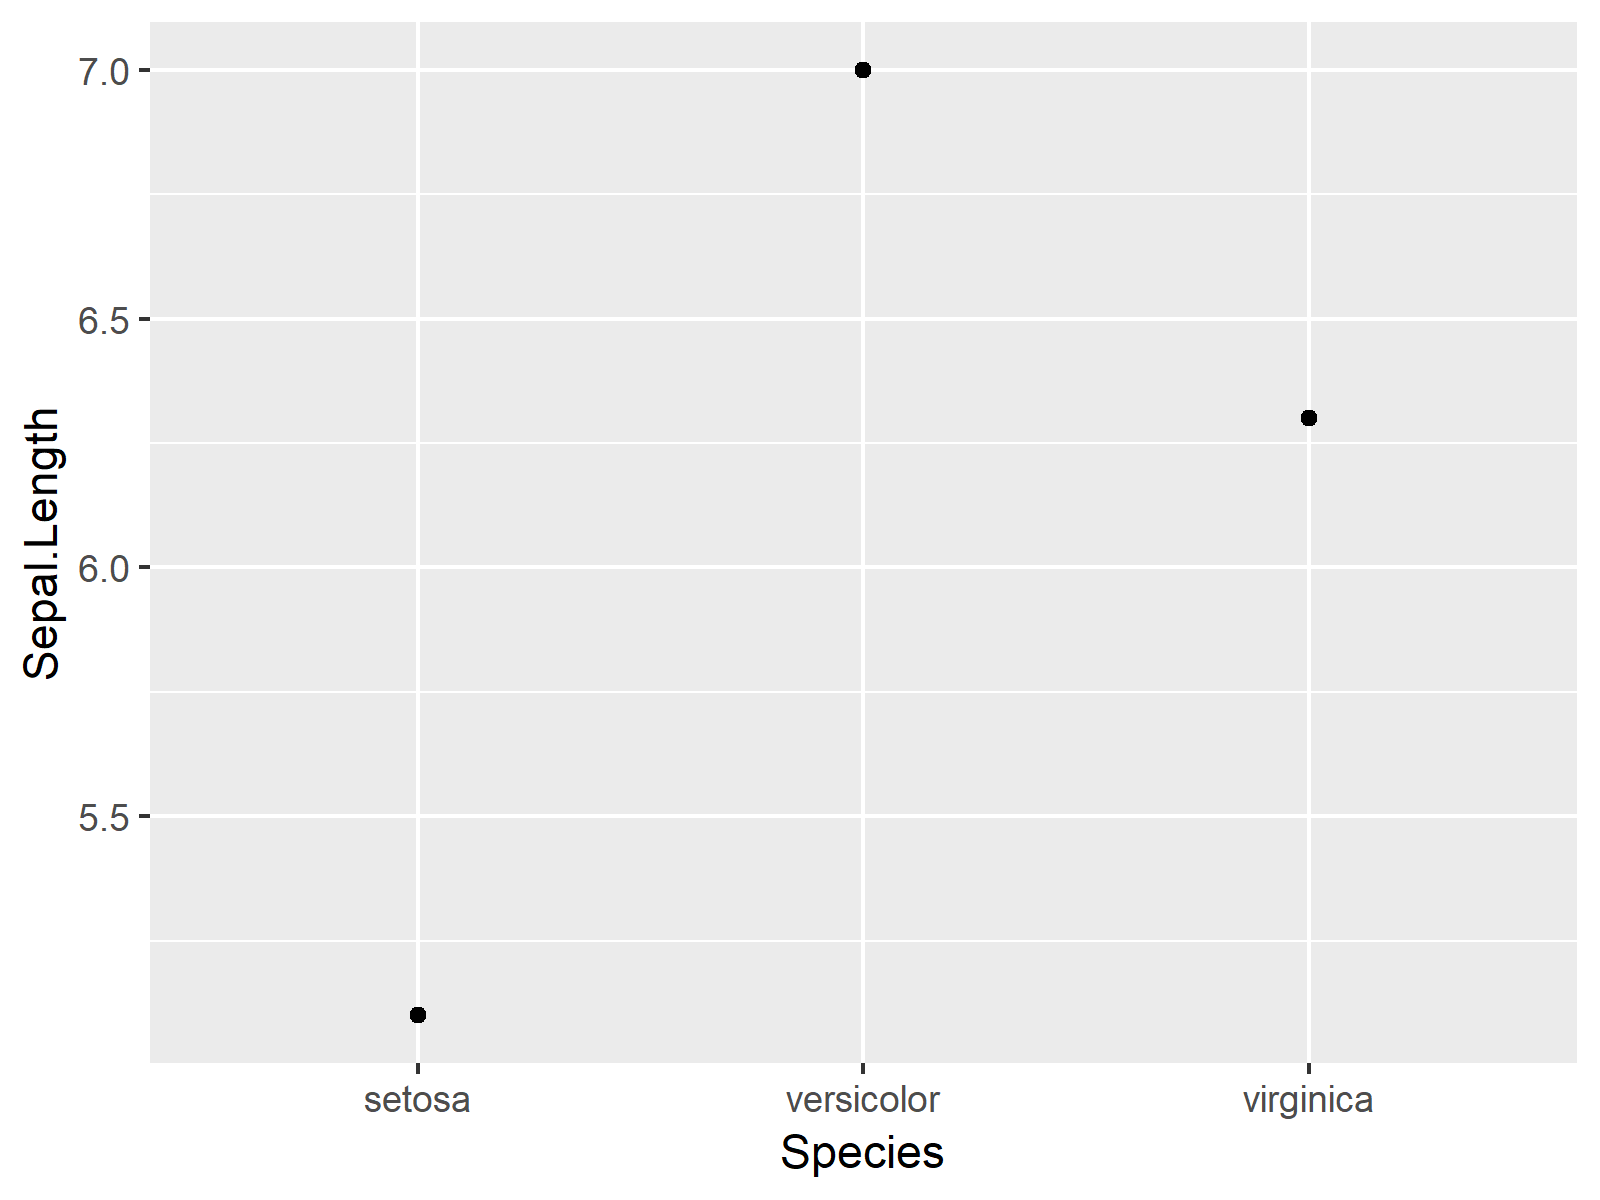
Example 1: Replicate the Warning Message – geom_path: Each group consists of only one observation. Do you need to adjust the group aesthetic?
install.packages("ggplot2") # Install ggplot2 package library("ggplot2") # Load ggplot2 package |
install.packages("ggplot2") # Install ggplot2 package library("ggplot2") # Load ggplot2 package
ggplot(iris_new, # Reproducing warning message aes(x = Species, y = Sepal.Length)) + geom_point() + geom_line() # geom_path: Each group consists of only one observation. Do you need to adjust the group aesthetic? |
ggplot(iris_new, # Reproducing warning message aes(x = Species, y = Sepal.Length)) + geom_point() + geom_line() # geom_path: Each group consists of only one observation. Do you need to adjust the group aesthetic?

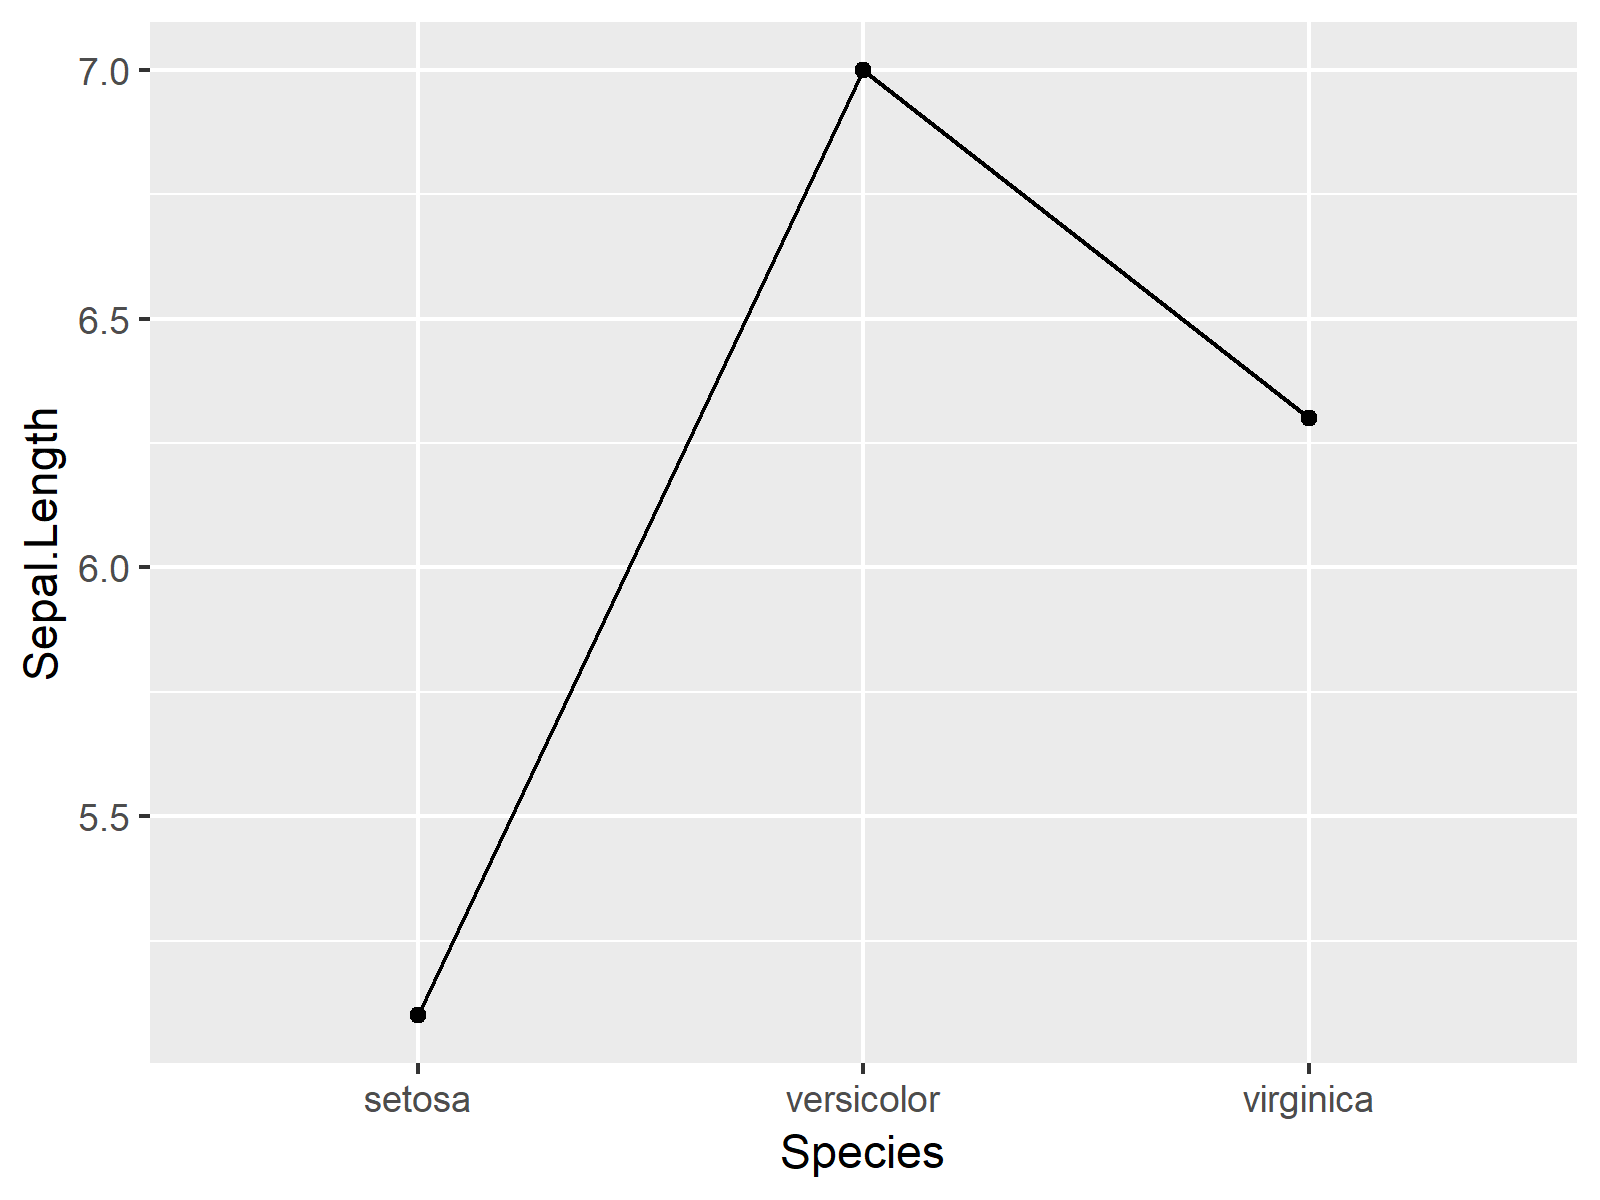
Example 2: Solve the Warning Message – geom_path: Each group consists of only one observation. Do you need to adjust the group aesthetic?
ggplot(iris_new, # Properly draw ggplot2 line chart aes(x = Species, y = Sepal.Length, group = 1)) + # This line of code is new! geom_point() + geom_line() |
ggplot(iris_new, # Properly draw ggplot2 line chart aes(x = Species, y = Sepal.Length, group = 1)) + # This line of code is new! geom_point() + geom_line()

Further Resources & Related Tutorials
Below, you can find some further resources on topics such as dplyr, ggplot2, graphics in R, and numeric values:
