Control Line Type & Shape of Plot in Base R (Example Code)
This tutorial shows how to modify the lines types in a plot in the R programming language.
Exemplifying Data
x <- 1:10 # Examplifying data y1 <- 1:10 y2 <- y1 + 1 y3 <- y1 + 2 y4 <- y1 + 3 y5 <- y1 + 4 y6 <- y1 + 5 |
x <- 1:10 # Examplifying data y1 <- 1:10 y2 <- y1 + 1 y3 <- y1 + 2 y4 <- y1 + 3 y5 <- y1 + 4 y6 <- y1 + 5
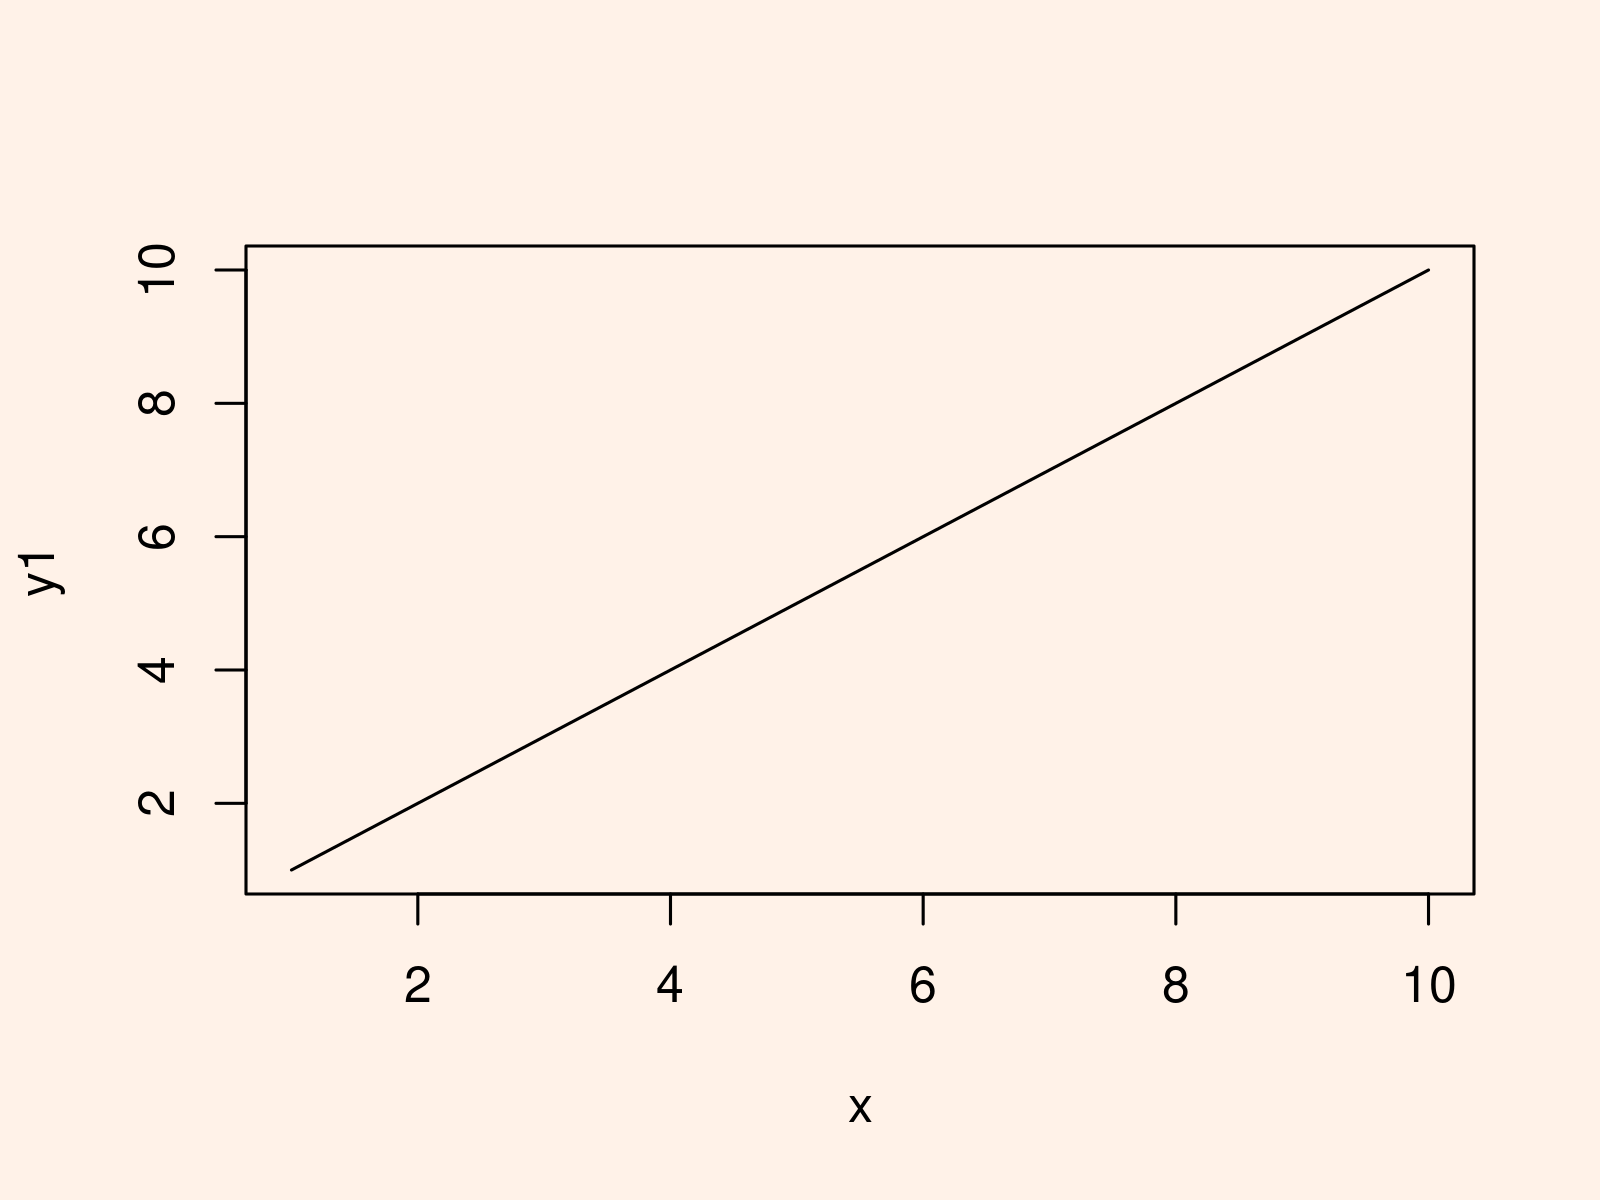
plot(x, y1, type = "l") # Create default line plot |
plot(x, y1, type = "l") # Create default line plot

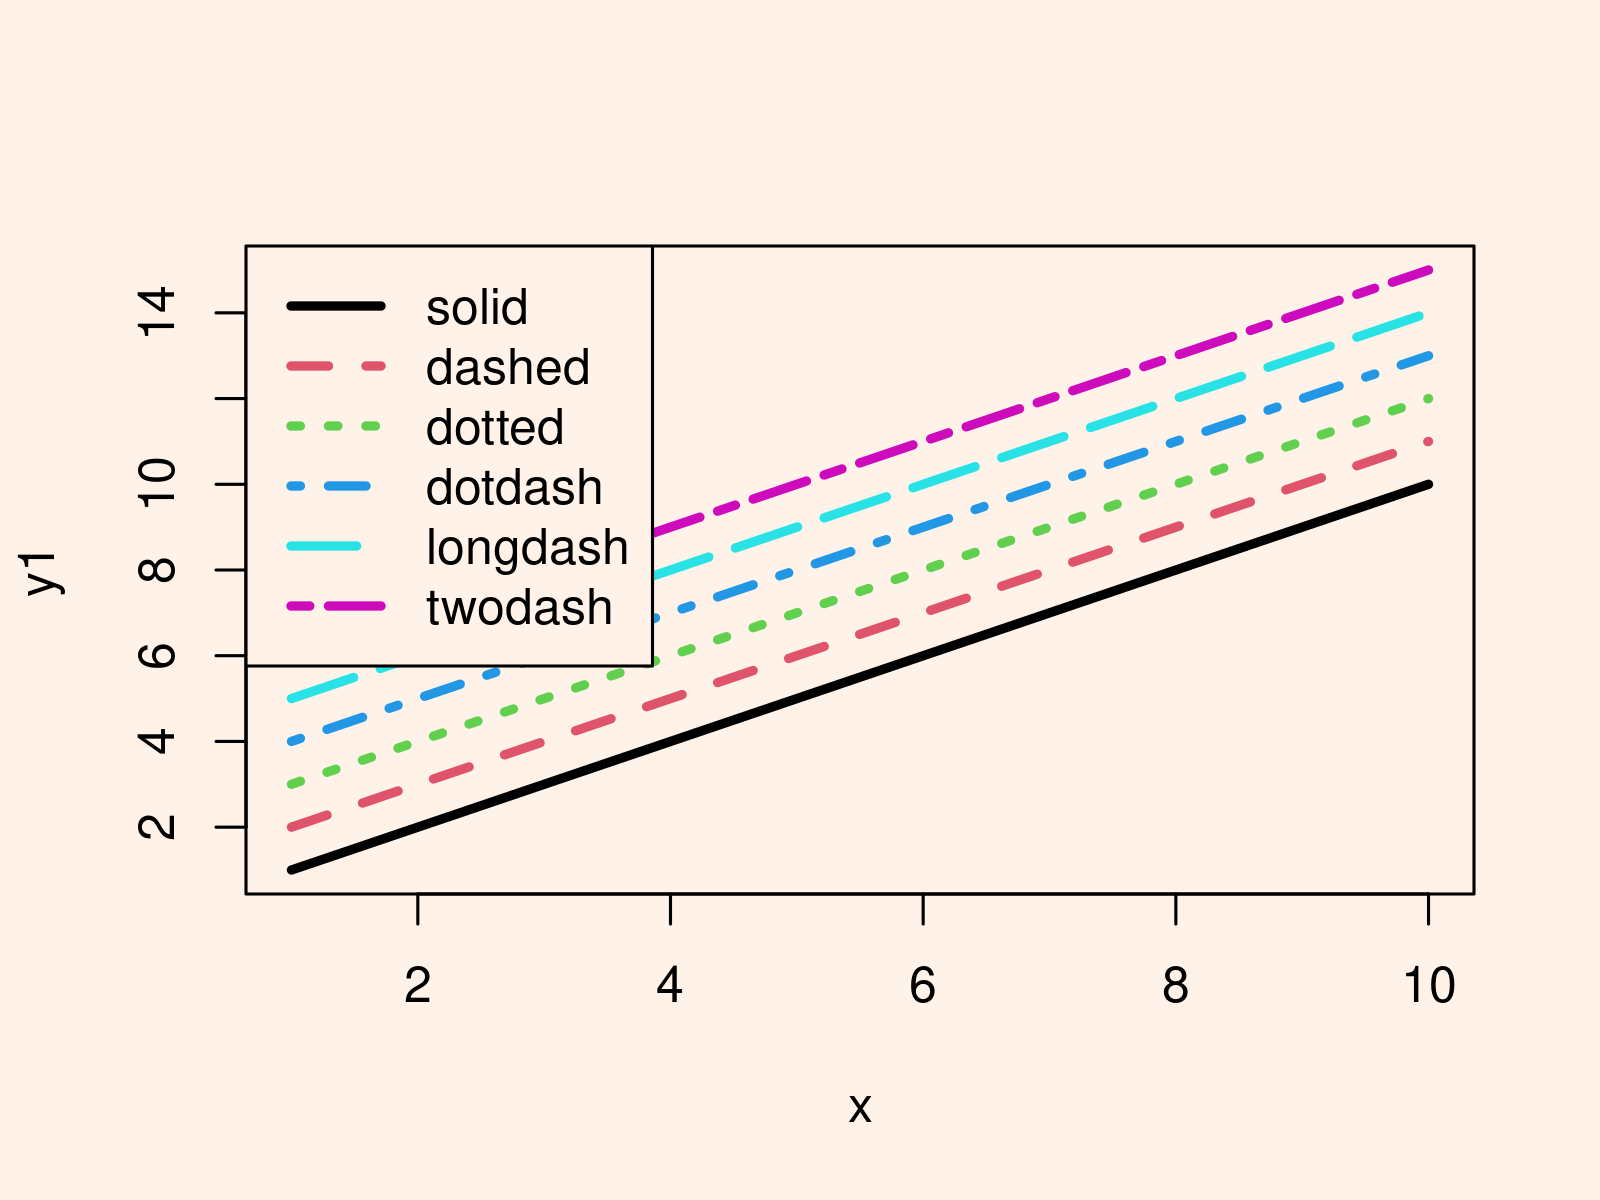
Example: Create Plot with Different Line Types
plot(x, y1, type = "l", lty = "solid", lwd = 3, ylim = c(1, 15)) # Multiple line types in same graph lines(x, y2, type = "l", lty = "dashed", lwd = 3, col = 2) lines(x, y3, type = "l", lty = "dotted", lwd = 3, col = 3) lines(x, y4, type = "l", lty = "dotdash", lwd = 3, col = 4) lines(x, y5, type = "l", lty = "longdash", lwd = 3, col = 5) lines(x, y6, type = "l", lty = "twodash", lwd = 3, col = 6) legend("topleft", c("solid", "dashed", "dotted", "dotdash", "longdash", "twodash"), col = 1:6, lty = 1:6, lwd = 3) |
plot(x, y1, type = "l", lty = "solid", lwd = 3, ylim = c(1, 15)) # Multiple line types in same graph lines(x, y2, type = "l", lty = "dashed", lwd = 3, col = 2) lines(x, y3, type = "l", lty = "dotted", lwd = 3, col = 3) lines(x, y4, type = "l", lty = "dotdash", lwd = 3, col = 4) lines(x, y5, type = "l", lty = "longdash", lwd = 3, col = 5) lines(x, y6, type = "l", lty = "twodash", lwd = 3, col = 6) legend("topleft", c("solid", "dashed", "dotted", "dotdash", "longdash", "twodash"), col = 1:6, lty = 1:6, lwd = 3)

