Control Drawing Order of Points in ggplot2 Plot in R (Example Code)
In this article you’ll learn how to control the order of points in a ggplot2 scatterplot in the R programming language.
Preparing the Example
data(iris) # Example data iris_new <- iris[ , c(1, 3)] iris_new$my_colors <- c("special", rep("rest", nrow(iris_new) - 1)) head(iris_new) # Sepal.Length Petal.Length my_colors # 1 5.1 1.4 special # 2 4.9 1.4 rest # 3 4.7 1.3 rest # 4 4.6 1.5 rest # 5 5.0 1.4 rest # 6 5.4 1.7 rest |
data(iris) # Example data iris_new <- iris[ , c(1, 3)] iris_new$my_colors <- c("special", rep("rest", nrow(iris_new) - 1)) head(iris_new) # Sepal.Length Petal.Length my_colors # 1 5.1 1.4 special # 2 4.9 1.4 rest # 3 4.7 1.3 rest # 4 4.6 1.5 rest # 5 5.0 1.4 rest # 6 5.4 1.7 rest
install.packages("ggplot2") # Install ggplot2 package library("ggplot2") # Load ggplot2 package |
install.packages("ggplot2") # Install ggplot2 package library("ggplot2") # Load ggplot2 package
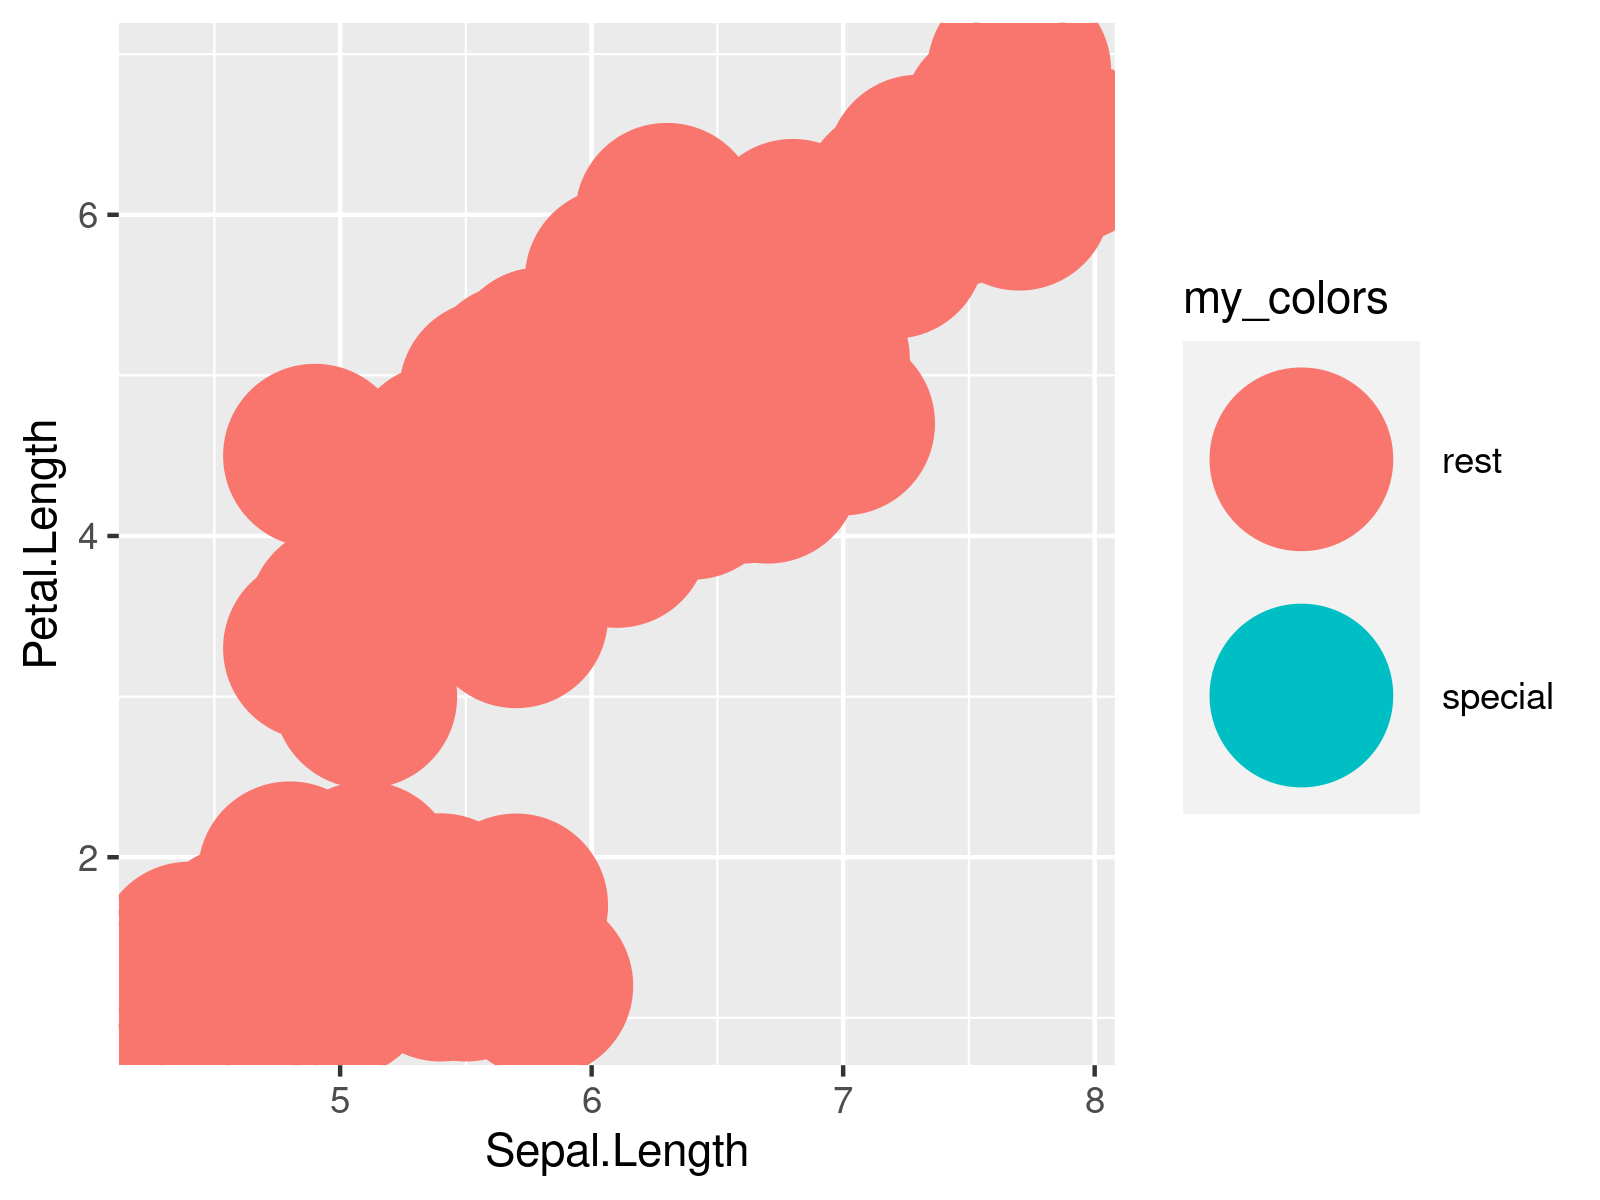
ggplot(iris_new, # Create plot with default ordering aes(x = Sepal.Length, y = Petal.Length, col = my_colors)) + geom_point(size = 20) |
ggplot(iris_new, # Create plot with default ordering aes(x = Sepal.Length, y = Petal.Length, col = my_colors)) + geom_point(size = 20)

Example: Reorder Rows of Data to Change Drawing Order of Points
iris_new2 <- iris_new[c(2:nrow(iris_new), 1), ] # Reordering iris data # Sepal.Length Petal.Length my_colors # 146 6.7 5.2 rest # 147 6.3 5.0 rest # 148 6.5 5.2 rest # 149 6.2 5.4 rest # 150 5.9 5.1 rest # 1 5.1 1.4 special tail(iris_new2) # Display bottom of reordered data |
iris_new2 <- iris_new[c(2:nrow(iris_new), 1), ] # Reordering iris data # Sepal.Length Petal.Length my_colors # 146 6.7 5.2 rest # 147 6.3 5.0 rest # 148 6.5 5.2 rest # 149 6.2 5.4 rest # 150 5.9 5.1 rest # 1 5.1 1.4 special tail(iris_new2) # Display bottom of reordered data
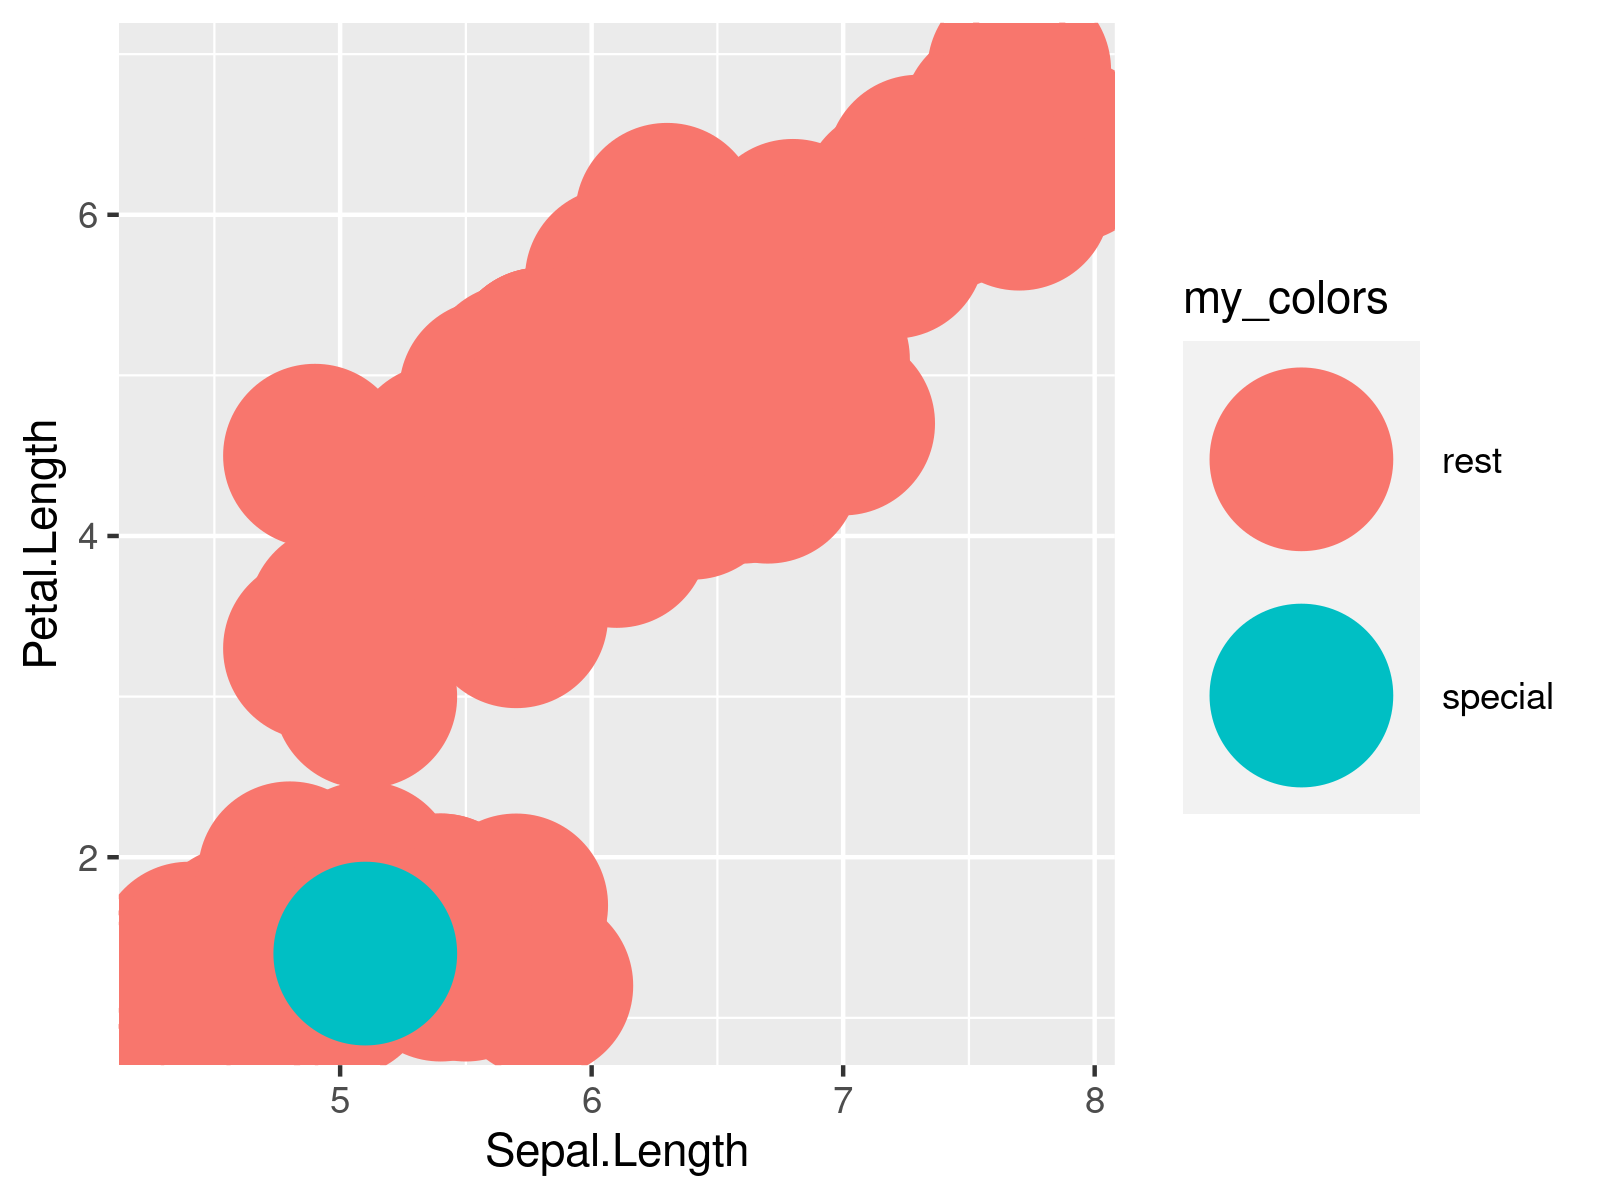
ggplot(iris_new2, # Plot with new order aes(x = Sepal.Length, y = Petal.Length, col = my_colors)) + geom_point(size = 20) |
ggplot(iris_new2, # Plot with new order aes(x = Sepal.Length, y = Petal.Length, col = my_colors)) + geom_point(size = 20)

Related Articles & Further Resources
Here, you can find some additional resources on topics such as graphics in R, ggplot2, and missing data.
