Eliminate Missing Values Before Drawing ggplot2 Plot in R (2 Examples)
This article illustrates how to eliminate NA values from a ggplot2 graphic in R.
Preparing the Examples
data(mtcars) # Loading mtcars data mtcars$mpg[c(1, 3, 6, 10, 15)] <- NA # Adding NA values to data head(mtcars) # Head of example data # mpg cyl disp hp drat wt qsec vs am gear carb # Mazda RX4 NA 6 160 110 3.90 2.620 16.46 0 1 4 4 # Mazda RX4 Wag 21.0 6 160 110 3.90 2.875 17.02 0 1 4 4 # Datsun 710 NA 4 108 93 3.85 2.320 18.61 1 1 4 1 # Hornet 4 Drive 21.4 6 258 110 3.08 3.215 19.44 1 0 3 1 # Hornet Sportabout 18.7 8 360 175 3.15 3.440 17.02 0 0 3 2 # Valiant NA 6 225 105 2.76 3.460 20.22 1 0 3 1 |
data(mtcars) # Loading mtcars data mtcars$mpg[c(1, 3, 6, 10, 15)] <- NA # Adding NA values to data head(mtcars) # Head of example data # mpg cyl disp hp drat wt qsec vs am gear carb # Mazda RX4 NA 6 160 110 3.90 2.620 16.46 0 1 4 4 # Mazda RX4 Wag 21.0 6 160 110 3.90 2.875 17.02 0 1 4 4 # Datsun 710 NA 4 108 93 3.85 2.320 18.61 1 1 4 1 # Hornet 4 Drive 21.4 6 258 110 3.08 3.215 19.44 1 0 3 1 # Hornet Sportabout 18.7 8 360 175 3.15 3.440 17.02 0 0 3 2 # Valiant NA 6 225 105 2.76 3.460 20.22 1 0 3 1
install.packages("ggplot2") # Install & load ggplot2 library("ggplot2") |
install.packages("ggplot2") # Install & load ggplot2 library("ggplot2")
Example 1: Draw ggplot2 Plot Based on Data Frame with Missing Values
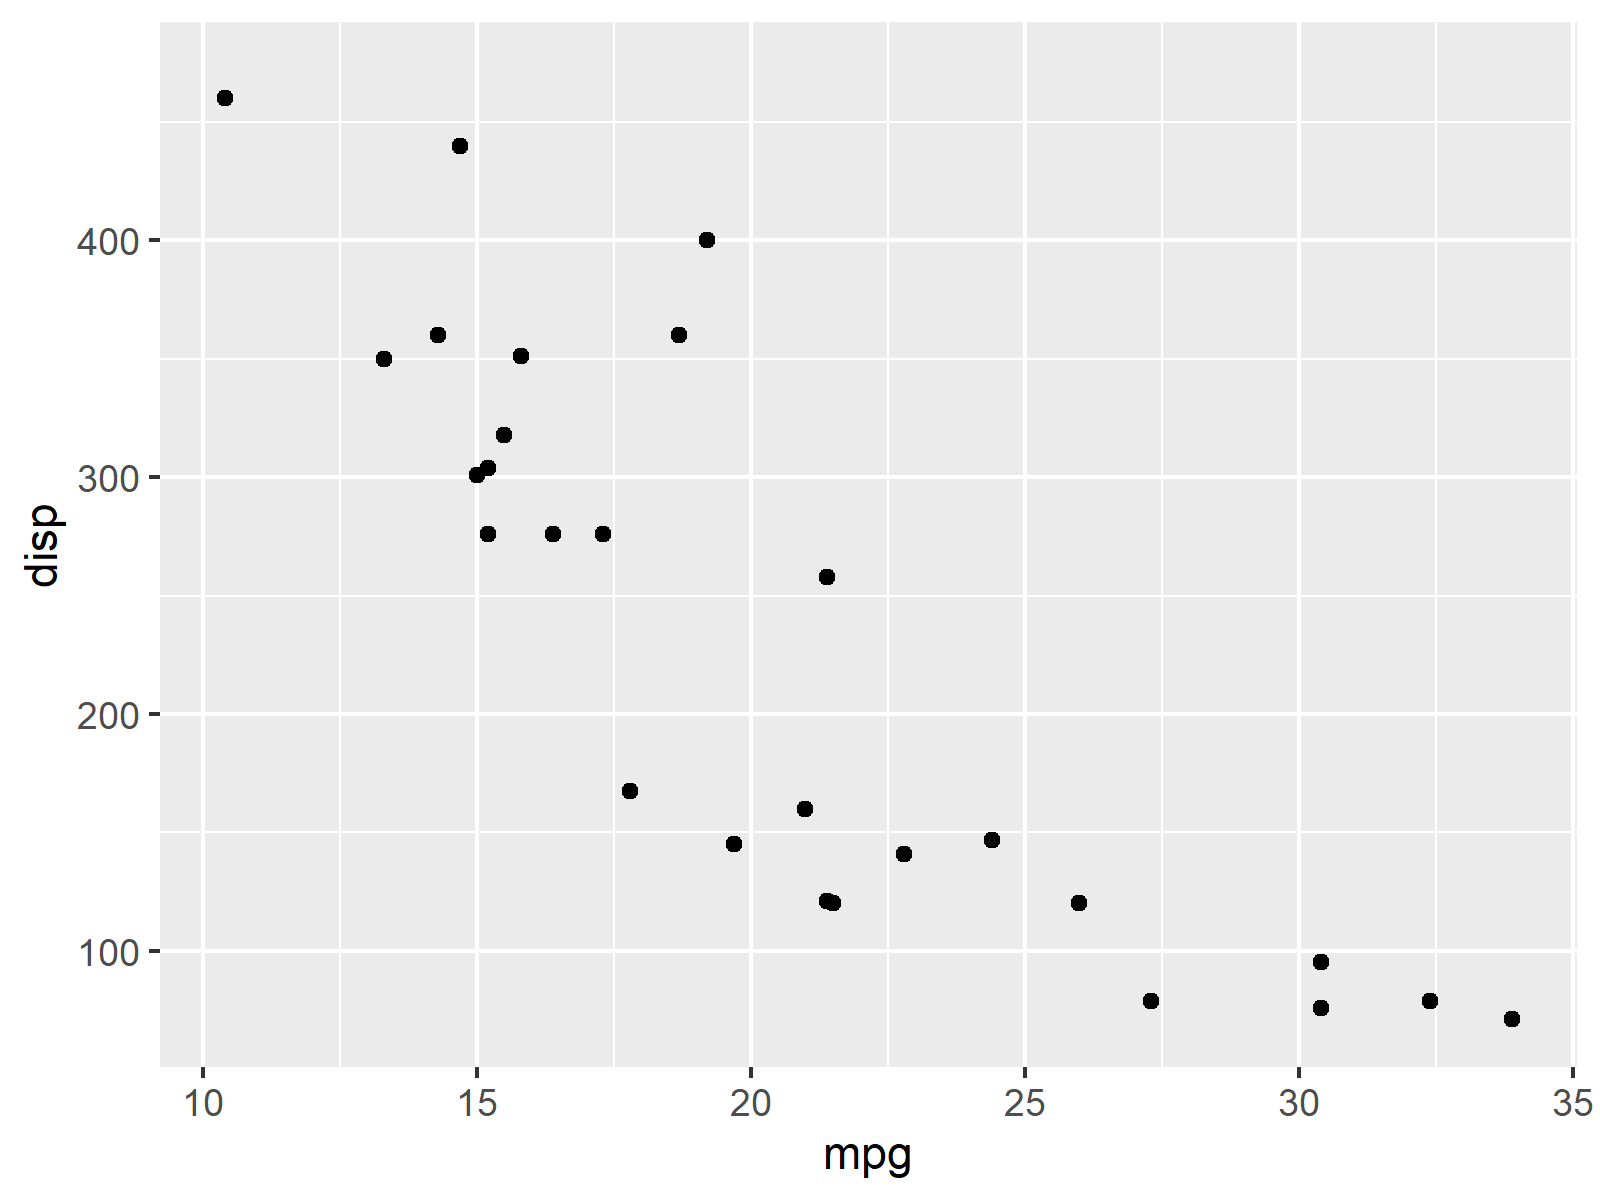
ggplot(mtcars, # Create ggplot2 graph with NA data (warning message) aes(mpg, disp)) + geom_point() # Warning message: # Removed 3 rows containing missing values (geom_point). |
ggplot(mtcars, # Create ggplot2 graph with NA data (warning message) aes(mpg, disp)) + geom_point() # Warning message: # Removed 3 rows containing missing values (geom_point).

Example 2: Remove NA Values Before Drawing ggplot2 Plot
mtcars_cc <- mtcars[complete.cases(mtcars[ , c("mpg", "disp")]), ] # Delete rows with NA head(mtcars_cc) # Show complete data in RStudio console # mpg cyl disp hp drat wt qsec vs am gear carb # Mazda RX4 Wag 21.0 6 160.0 110 3.90 2.875 17.02 0 1 4 4 # Hornet 4 Drive 21.4 6 258.0 110 3.08 3.215 19.44 1 0 3 1 # Hornet Sportabout 18.7 8 360.0 175 3.15 3.440 17.02 0 0 3 2 # Duster 360 14.3 8 360.0 245 3.21 3.570 15.84 0 0 3 4 # Merc 240D 24.4 4 146.7 62 3.69 3.190 20.00 1 0 4 2 # Merc 230 22.8 4 140.8 95 3.92 3.150 22.90 1 0 4 2 |
mtcars_cc <- mtcars[complete.cases(mtcars[ , c("mpg", "disp")]), ] # Delete rows with NA head(mtcars_cc) # Show complete data in RStudio console # mpg cyl disp hp drat wt qsec vs am gear carb # Mazda RX4 Wag 21.0 6 160.0 110 3.90 2.875 17.02 0 1 4 4 # Hornet 4 Drive 21.4 6 258.0 110 3.08 3.215 19.44 1 0 3 1 # Hornet Sportabout 18.7 8 360.0 175 3.15 3.440 17.02 0 0 3 2 # Duster 360 14.3 8 360.0 245 3.21 3.570 15.84 0 0 3 4 # Merc 240D 24.4 4 146.7 62 3.69 3.190 20.00 1 0 4 2 # Merc 230 22.8 4 140.8 95 3.92 3.150 22.90 1 0 4 2
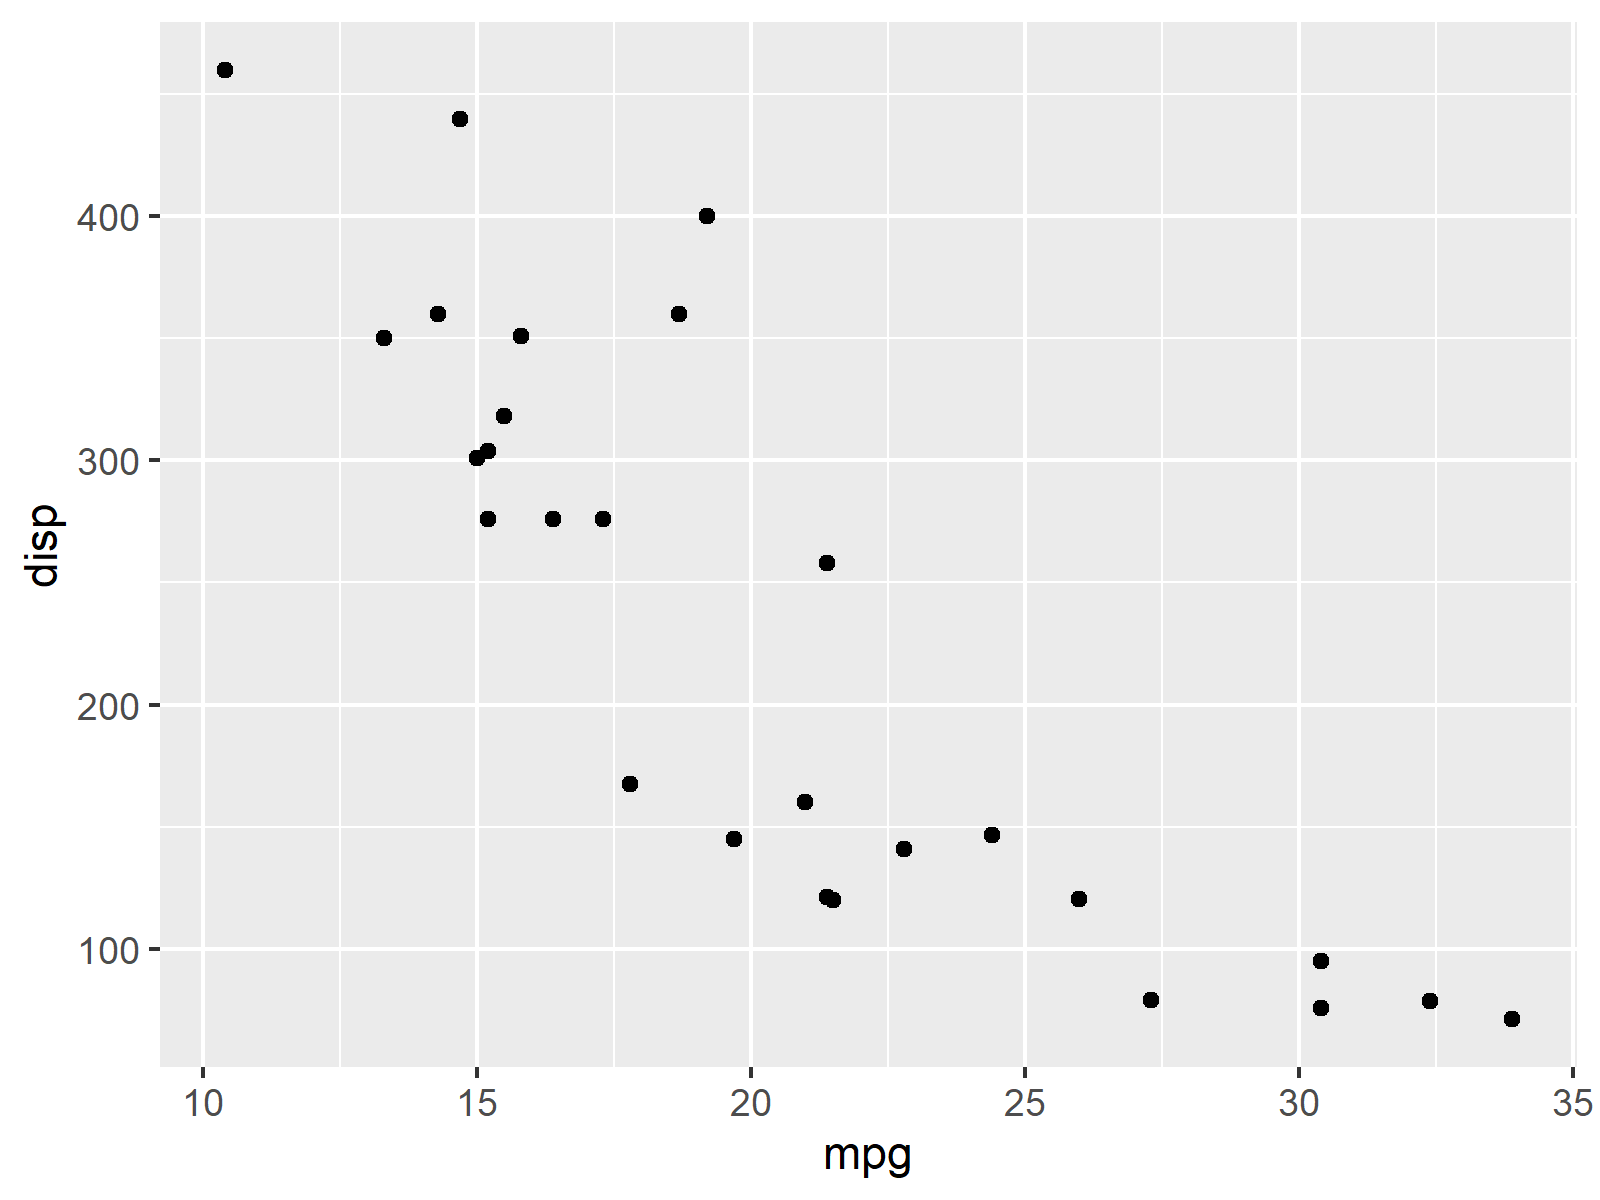
ggplot(mtcars_cc, # Create ggplot2 graph with complete data aes(mpg, disp)) + geom_point() |
ggplot(mtcars_cc, # Create ggplot2 graph with complete data aes(mpg, disp)) + geom_point()

Figure 2 is exactly the same as Figure 1. However, this time the RStudio console didn’t return a warning message after executing the ggplot2 functions.
Related Articles
In the following, you can find some additional resources that are similar to the topic of this page:
