Draw Grid with Tick Marks on Corresponding Default Axis in R (Example Code)
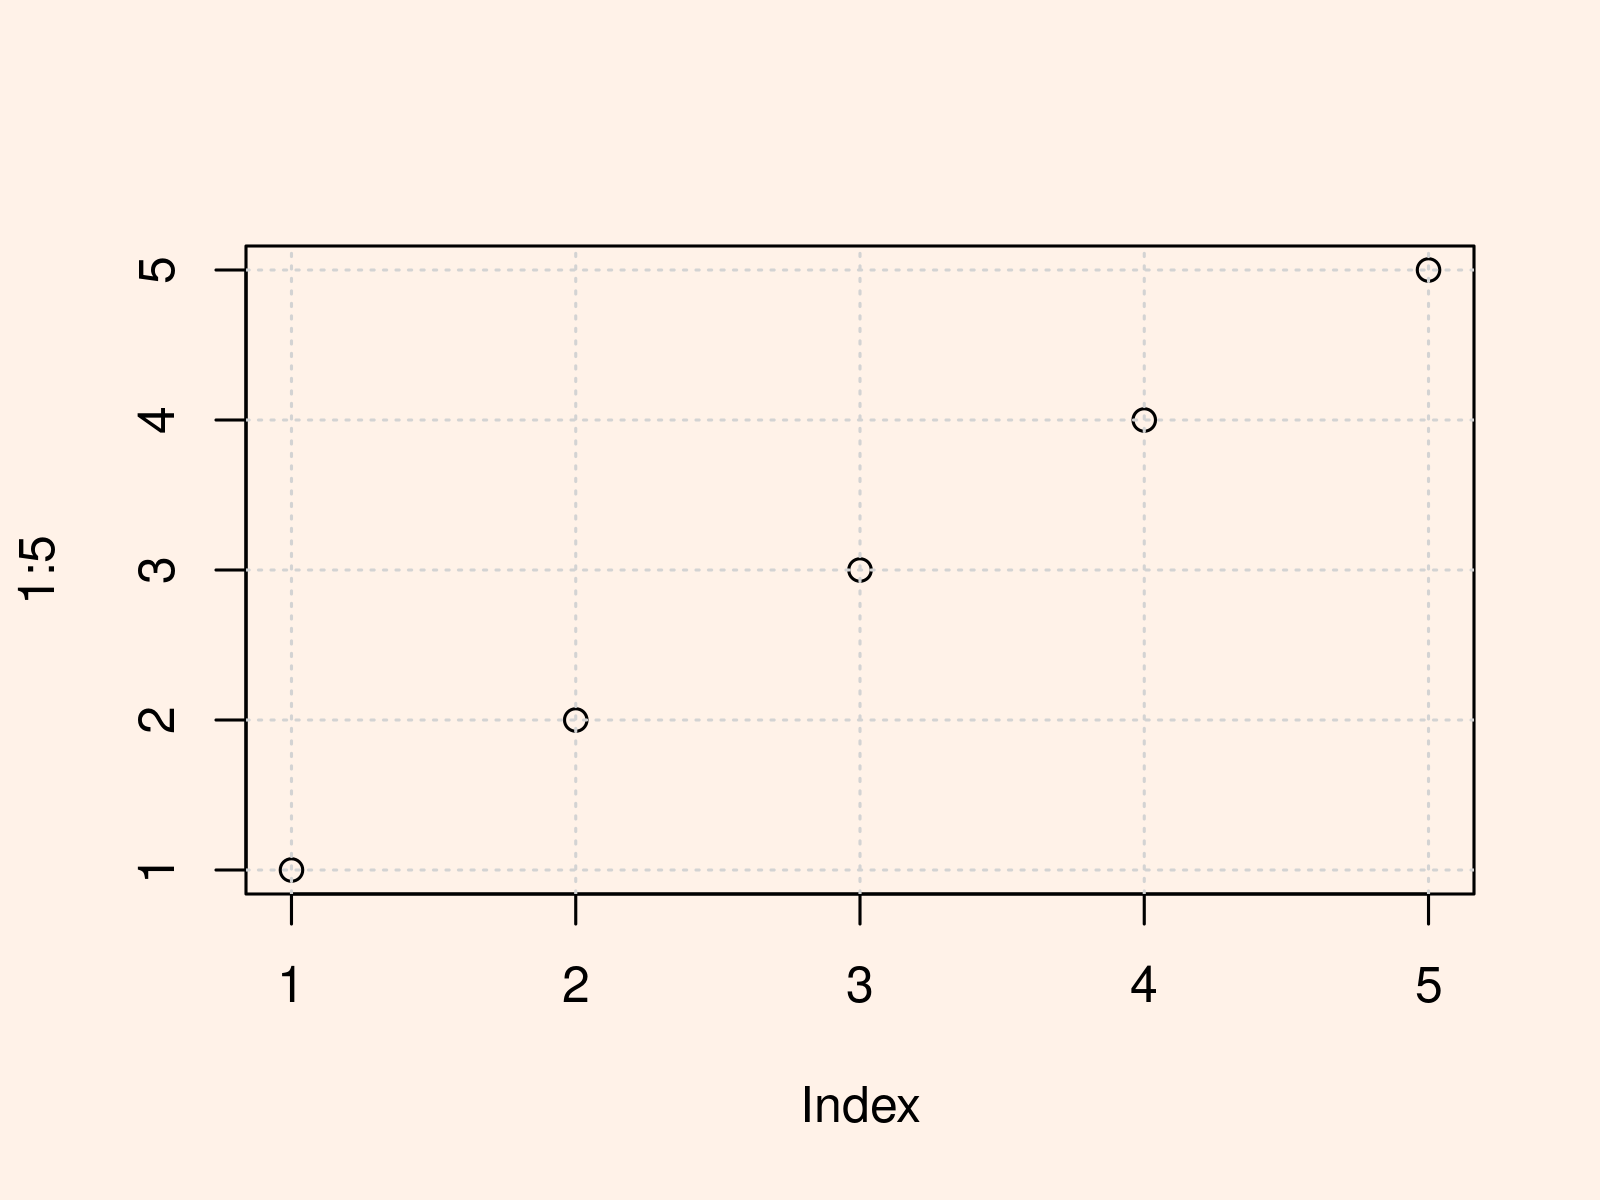
In this R tutorial you’ll learn how to add a grid to a graphic with tick marks on the corresponding default axis.
Example: Add Grid Line Consistent with Ticks on Axes
plot(1:5) # Create Base R plot grid(NULL, NULL) # Draw grid to plot |
plot(1:5) # Create Base R plot grid(NULL, NULL) # Draw grid to plot

Related Tutorials
Have a look at the following R programming tutorials. They discuss topics such as labels, ggplot2, and graphics in R:
