Specify xlim & ylim for Log-Scale in Base R Plot (2 Examples)
This article demonstrates how to set xlim & ylim for a log-scale in a Base R plot in the R programming language.
Example Data
data(iris) # Example data head(iris) # Sepal.Length Sepal.Width Petal.Length Petal.Width Species # 1 5.1 3.5 1.4 0.2 setosa # 2 4.9 3.0 1.4 0.2 setosa # 3 4.7 3.2 1.3 0.2 setosa # 4 4.6 3.1 1.5 0.2 setosa # 5 5.0 3.6 1.4 0.2 setosa # 6 5.4 3.9 1.7 0.4 setosa |
data(iris) # Example data head(iris) # Sepal.Length Sepal.Width Petal.Length Petal.Width Species # 1 5.1 3.5 1.4 0.2 setosa # 2 4.9 3.0 1.4 0.2 setosa # 3 4.7 3.2 1.3 0.2 setosa # 4 4.6 3.1 1.5 0.2 setosa # 5 5.0 3.6 1.4 0.2 setosa # 6 5.4 3.9 1.7 0.4 setosa
Example 1: How to Replicate the Warning messages: In plot.window(…) : nonfinite axis limits [GScale(-inf,1,1, .); log=1]
plot(iris$Sepal.Length, # Try to use lower limit of zero iris$Sepal.Width, log = "xy", xlim = c(0, 100), ylim = c(0, 100)) # Warning messages: # 1: In plot.window(...) : # nonfinite axis limits [GScale(-inf,1,1, .); log=1] # 2: In plot.window(...) : # nonfinite axis limits [GScale(-inf,1,2, .); log=1] |
plot(iris$Sepal.Length, # Try to use lower limit of zero iris$Sepal.Width, log = "xy", xlim = c(0, 100), ylim = c(0, 100)) # Warning messages: # 1: In plot.window(...) : # nonfinite axis limits [GScale(-inf,1,1, .); log=1] # 2: In plot.window(...) : # nonfinite axis limits [GScale(-inf,1,2, .); log=1]

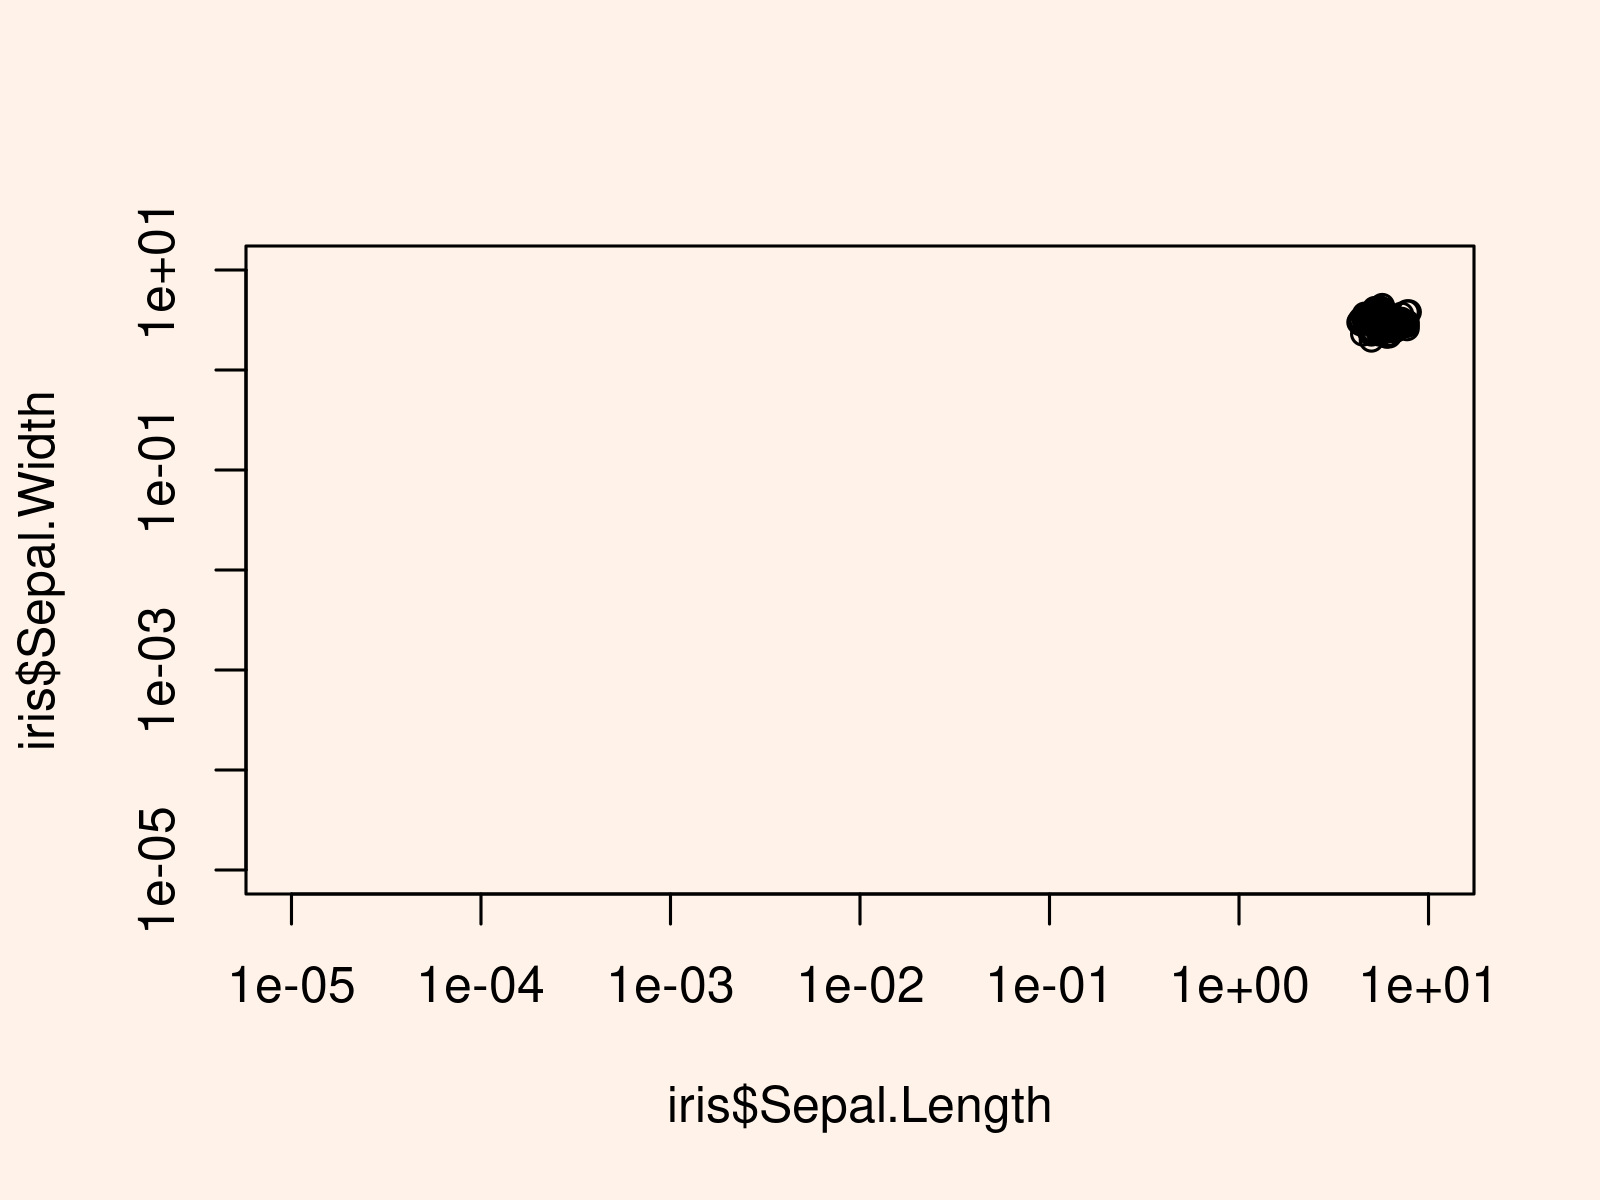
Example 2: How to Solve the Warning messages: In plot.window(…) : nonfinite axis limits [GScale(-inf,1,1, .); log=1]
plot(iris$Sepal.Length, # Set lower axis limits slightly higher iris$Sepal.Width, log = "xy", xlim = c(0.00001, 10), ylim = c(0.00001, 10)) |
plot(iris$Sepal.Length, # Set lower axis limits slightly higher iris$Sepal.Width, log = "xy", xlim = c(0.00001, 10), ylim = c(0.00001, 10))

Further Resources & Related Tutorials
You may find some related R tutorials in the following list:
