Using Real Values as Axis Ticks of Plot in R (Example Code)
In this article, I’ll show how to use the real values of a plot as axis ticks in the R programming language.
Creating Example Data
data(iris) # Load example data head(iris) # Sepal.Length Sepal.Width Petal.Length Petal.Width Species # 1 5.1 3.5 1.4 0.2 setosa # 2 4.9 3.0 1.4 0.2 setosa # 3 4.7 3.2 1.3 0.2 setosa # 4 4.6 3.1 1.5 0.2 setosa # 5 5.0 3.6 1.4 0.2 setosa # 6 5.4 3.9 1.7 0.4 setosa |
data(iris) # Load example data head(iris) # Sepal.Length Sepal.Width Petal.Length Petal.Width Species # 1 5.1 3.5 1.4 0.2 setosa # 2 4.9 3.0 1.4 0.2 setosa # 3 4.7 3.2 1.3 0.2 setosa # 4 4.6 3.1 1.5 0.2 setosa # 5 5.0 3.6 1.4 0.2 setosa # 6 5.4 3.9 1.7 0.4 setosa
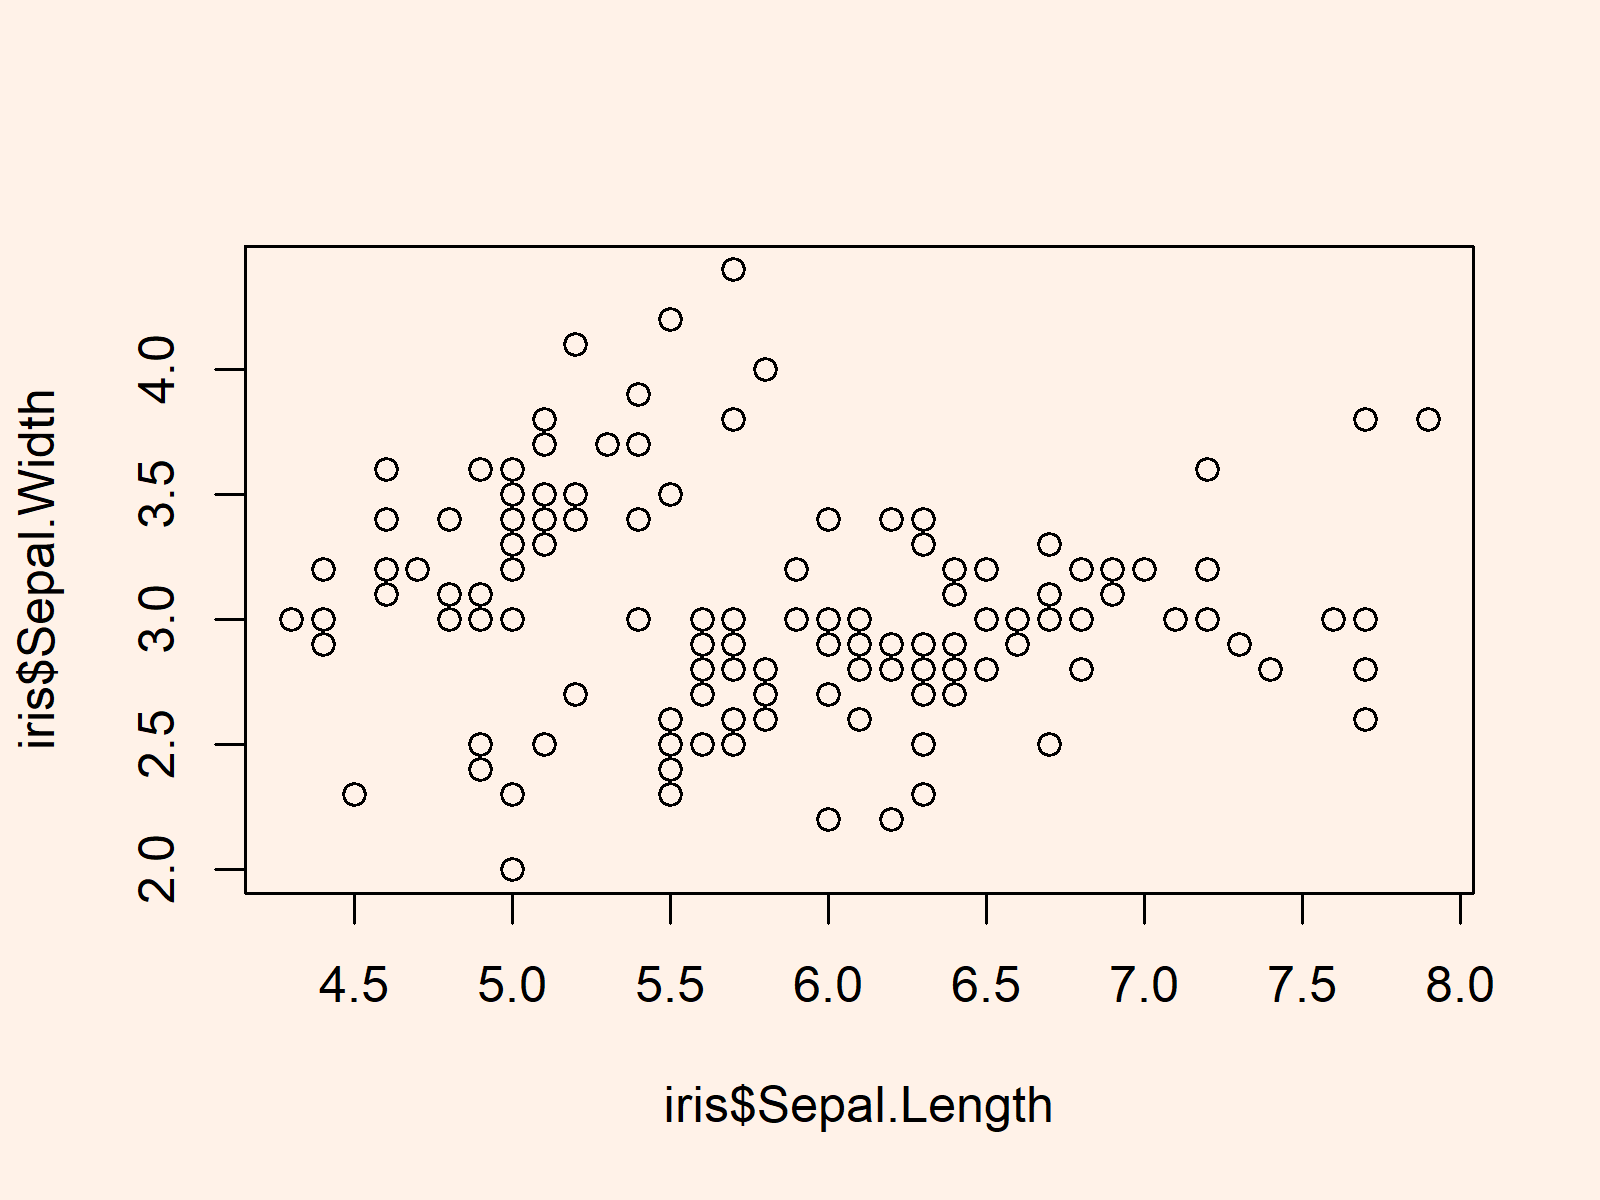
plot(iris$Sepal.Length, # Plotting default scatterplot iris$Sepal.Width) |
plot(iris$Sepal.Length, # Plotting default scatterplot iris$Sepal.Width)

Example: Applying axis() & seq() Functions to Create Scatterplot with Manually Specified Y-Axis
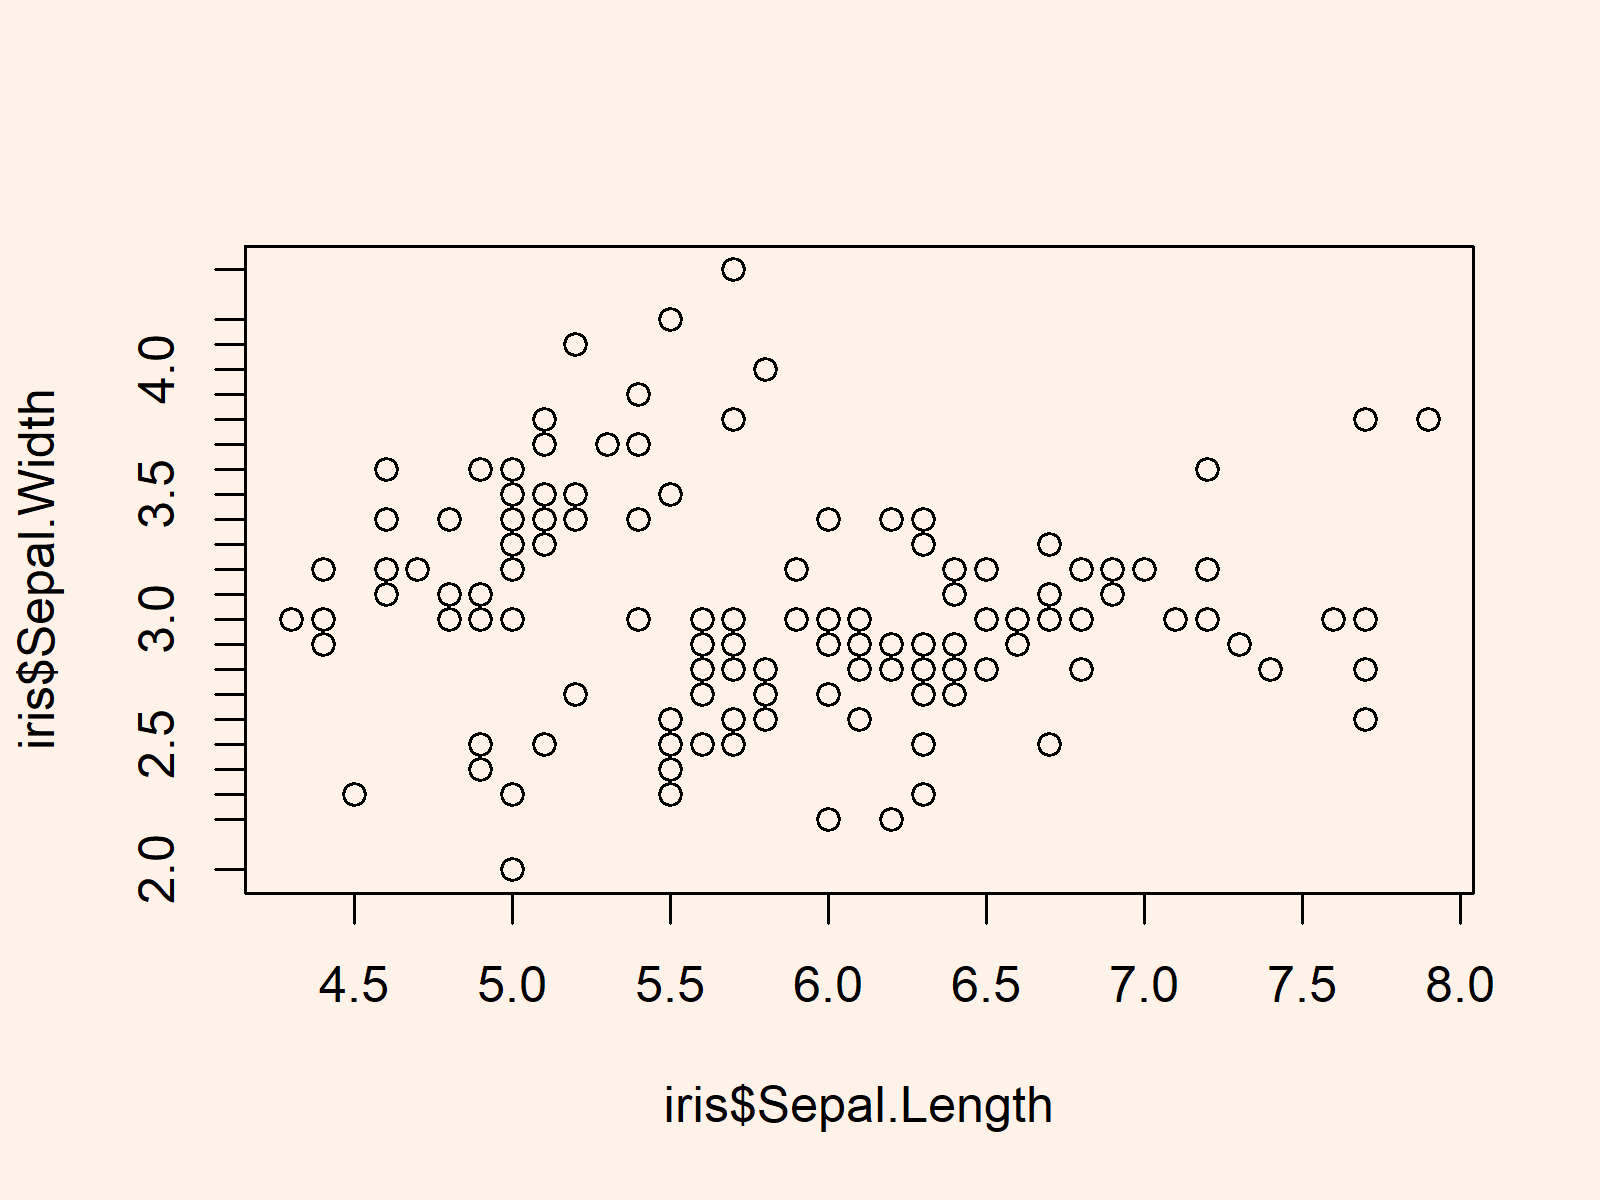
plot(iris$Sepal.Length, # Scatterplot without y-axis iris$Sepal.Width, yaxt = "n") axis(2, # Using axis() function at = iris$Sepal.Width) |
plot(iris$Sepal.Length, # Scatterplot without y-axis iris$Sepal.Width, yaxt = "n") axis(2, # Using axis() function at = iris$Sepal.Width)

Further Resources & Related Articles
In addition, you might want to read the other articles of this website. I have released numerous other articles on topics such as ggplot2, graphics in r, and labels.
