Date Range as ggplot2 Plot Axis Limits in R (Example Code)
In this post you’ll learn how to use dates as the limits of a ggplot2 plot axis scale in R programming.
Preparing the Example
set.seed(589673) my_df <- data.frame(dates = seq(as.Date("2025-05-10"), # Construct example data by = "day", length.out = 6), values = rnorm(6)) my_df # Display example data in RStudio console # dates values # 1 2025-05-10 0.9753311 # 2 2025-05-11 -0.5530573 # 3 2025-05-12 0.1372695 # 4 2025-05-13 -1.4207424 # 5 2025-05-14 -0.8352222 # 6 2025-05-15 0.1896417 |
set.seed(589673) my_df <- data.frame(dates = seq(as.Date("2025-05-10"), # Construct example data by = "day", length.out = 6), values = rnorm(6)) my_df # Display example data in RStudio console # dates values # 1 2025-05-10 0.9753311 # 2 2025-05-11 -0.5530573 # 3 2025-05-12 0.1372695 # 4 2025-05-13 -1.4207424 # 5 2025-05-14 -0.8352222 # 6 2025-05-15 0.1896417
install.packages("ggplot2") # Install ggplot2 package library("ggplot2") # Load ggplot2 |
install.packages("ggplot2") # Install ggplot2 package library("ggplot2") # Load ggplot2
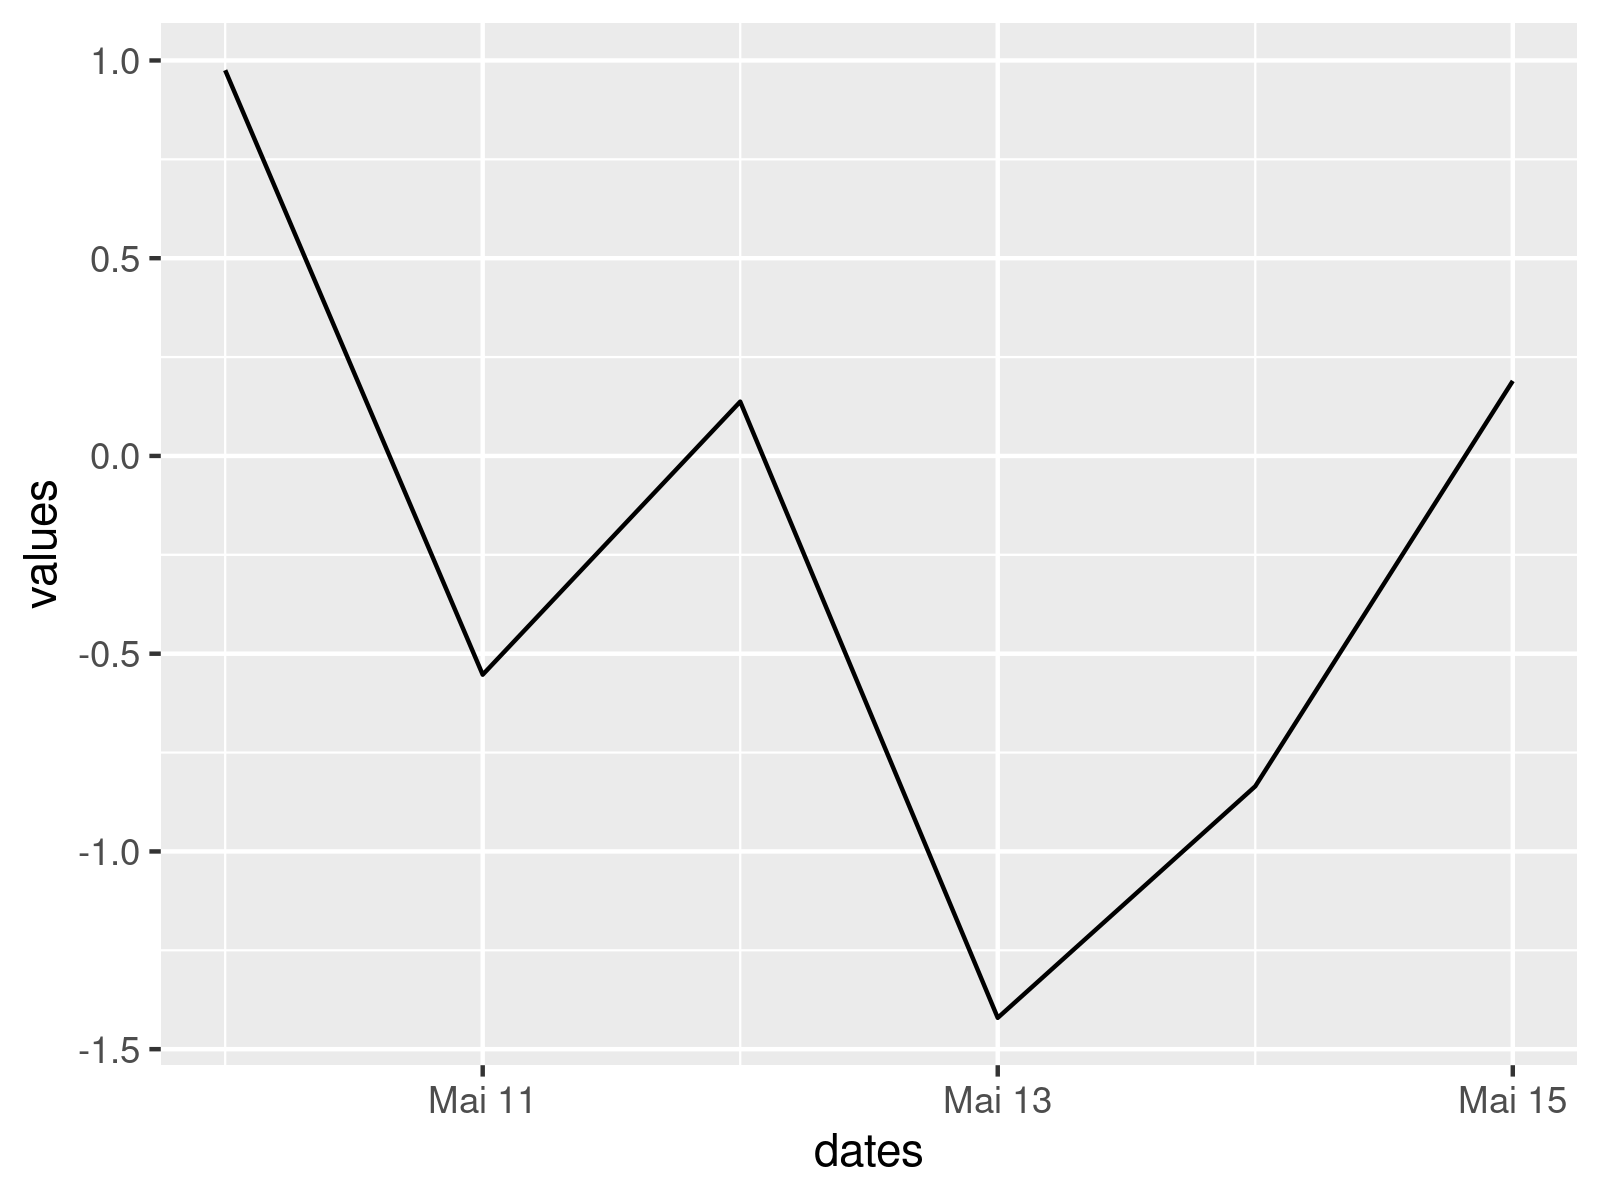
my_plot <- ggplot(my_df, # Draw plot with default axes aes(x = dates, y = values)) + geom_line() my_plot |
my_plot <- ggplot(my_df, # Draw plot with default axes aes(x = dates, y = values)) + geom_line() my_plot

Example: Specify the Limits of a ggplot2 Axis Using Dates
install.packages("scales") # Install & load scales package library("scales") |
install.packages("scales") # Install & load scales package library("scales")
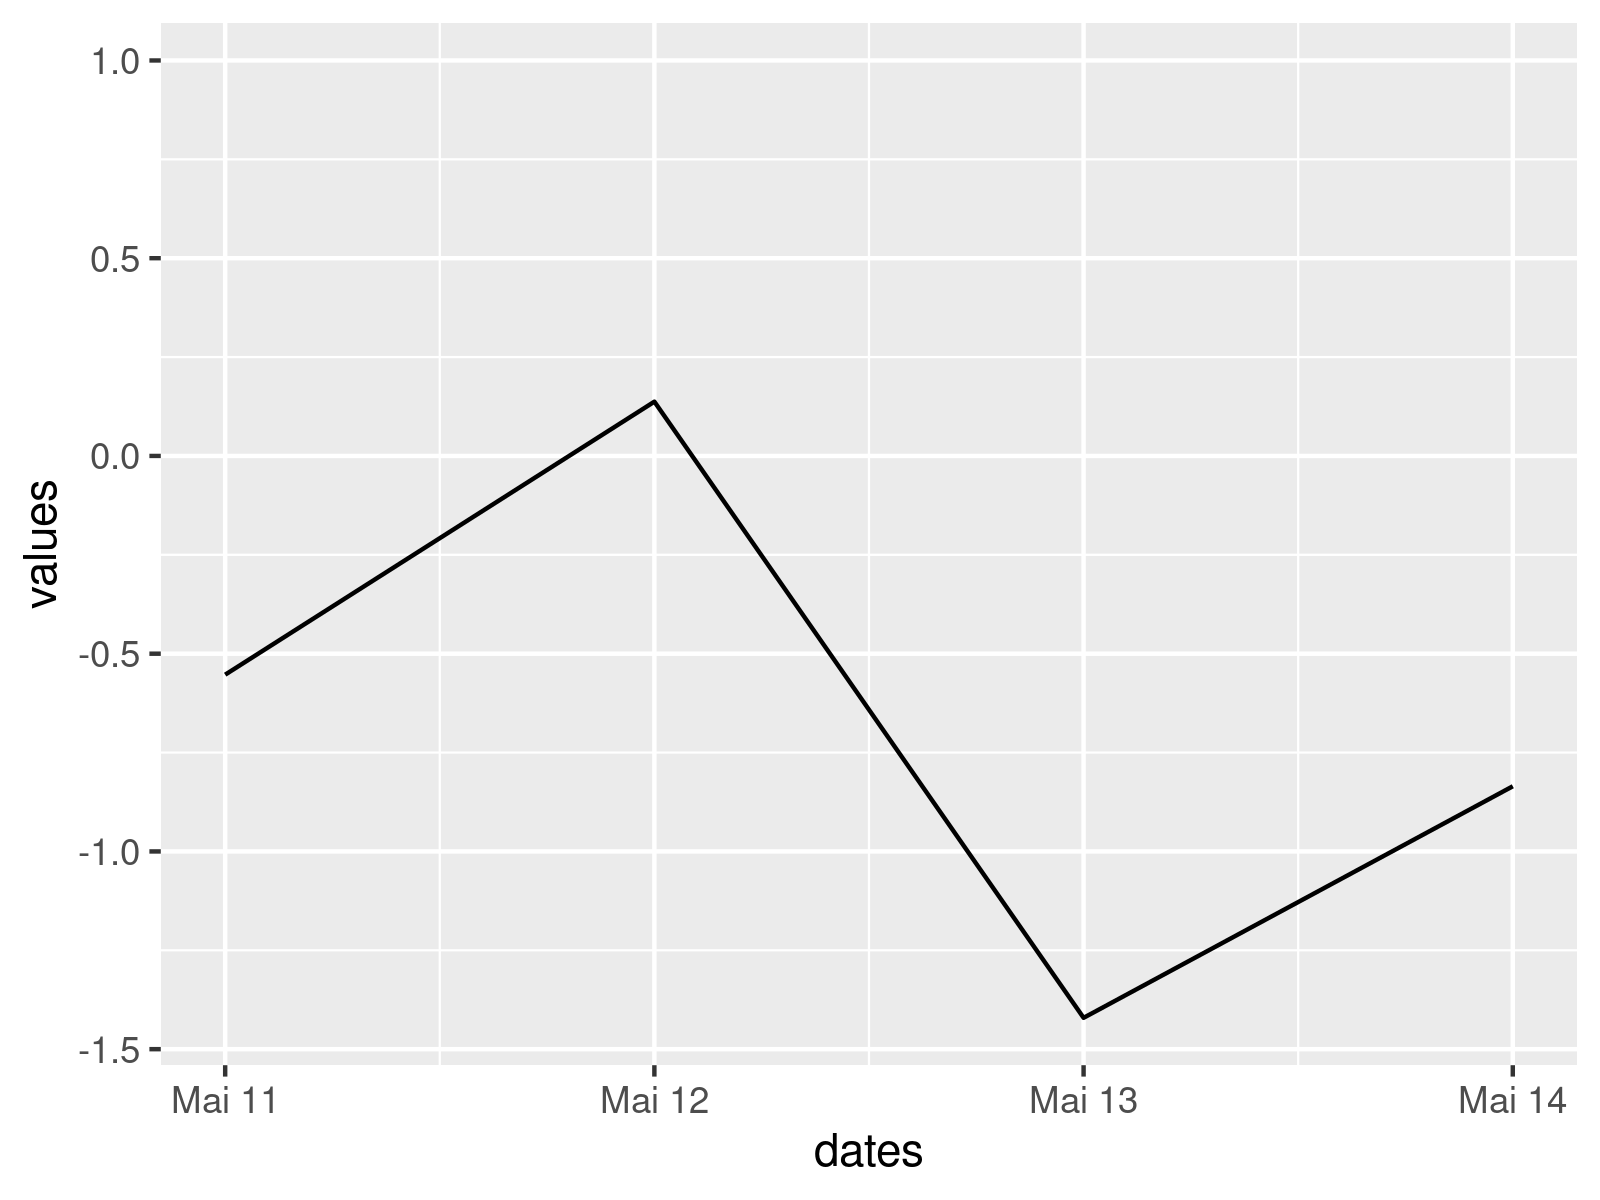
my_plot + # Define axis limits scale_x_date(limits = as.Date(c("2025-05-11", "2025-05-14"))) |
my_plot + # Define axis limits scale_x_date(limits = as.Date(c("2025-05-11", "2025-05-14")))

