Plotting Multiple Function Curves to Same Graphic in R (2 Examples)
In this tutorial you’ll learn how to print several functions to the same graphic in R programming.
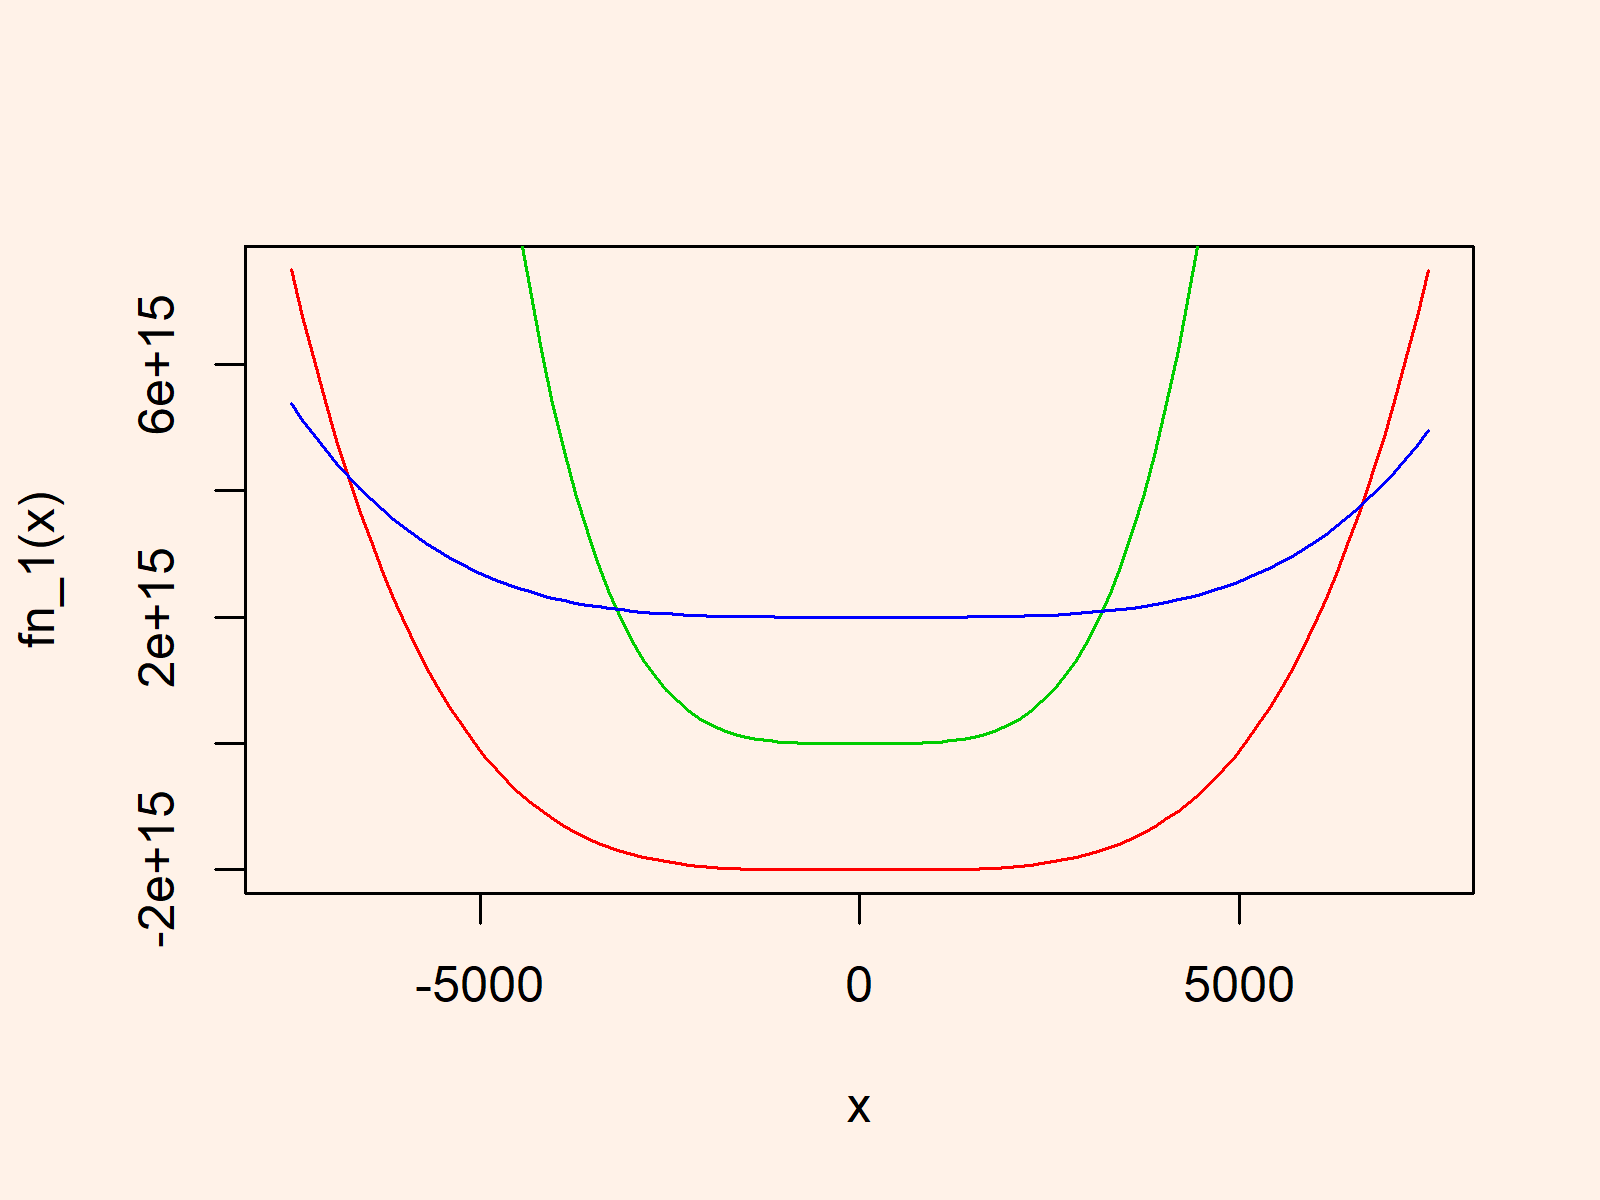
Example 1: Using Base R to Draw Several Curves to Same Plot
fn_1 <- function(x) { # Creating three user-defined functions x^4 * 3 - x^3 - x^2 * 00 - 2 * 10^15 } fn_2 <- function(x) { x^4 * 20 + x^2 + x * 70 } fn_3 <- function(x) { x^4 - x^3 * 500 - x^2 * 150 + 2 * 10^15 } |
fn_1 <- function(x) { # Creating three user-defined functions x^4 * 3 - x^3 - x^2 * 00 - 2 * 10^15 } fn_2 <- function(x) { x^4 * 20 + x^2 + x * 70 } fn_3 <- function(x) { x^4 - x^3 * 500 - x^2 * 150 + 2 * 10^15 }
curve(fn_1, # Plotting curves in Base R from = - 7500, to = 7500, col = 2) curve(fn_2, from = - 7500, to = 7500, col = 3, add = TRUE) curve(fn_3, from = - 7500, to = 7500, col = 4, add = TRUE) |
curve(fn_1, # Plotting curves in Base R from = - 7500, to = 7500, col = 2) curve(fn_2, from = - 7500, to = 7500, col = 3, add = TRUE) curve(fn_3, from = - 7500, to = 7500, col = 4, add = TRUE)

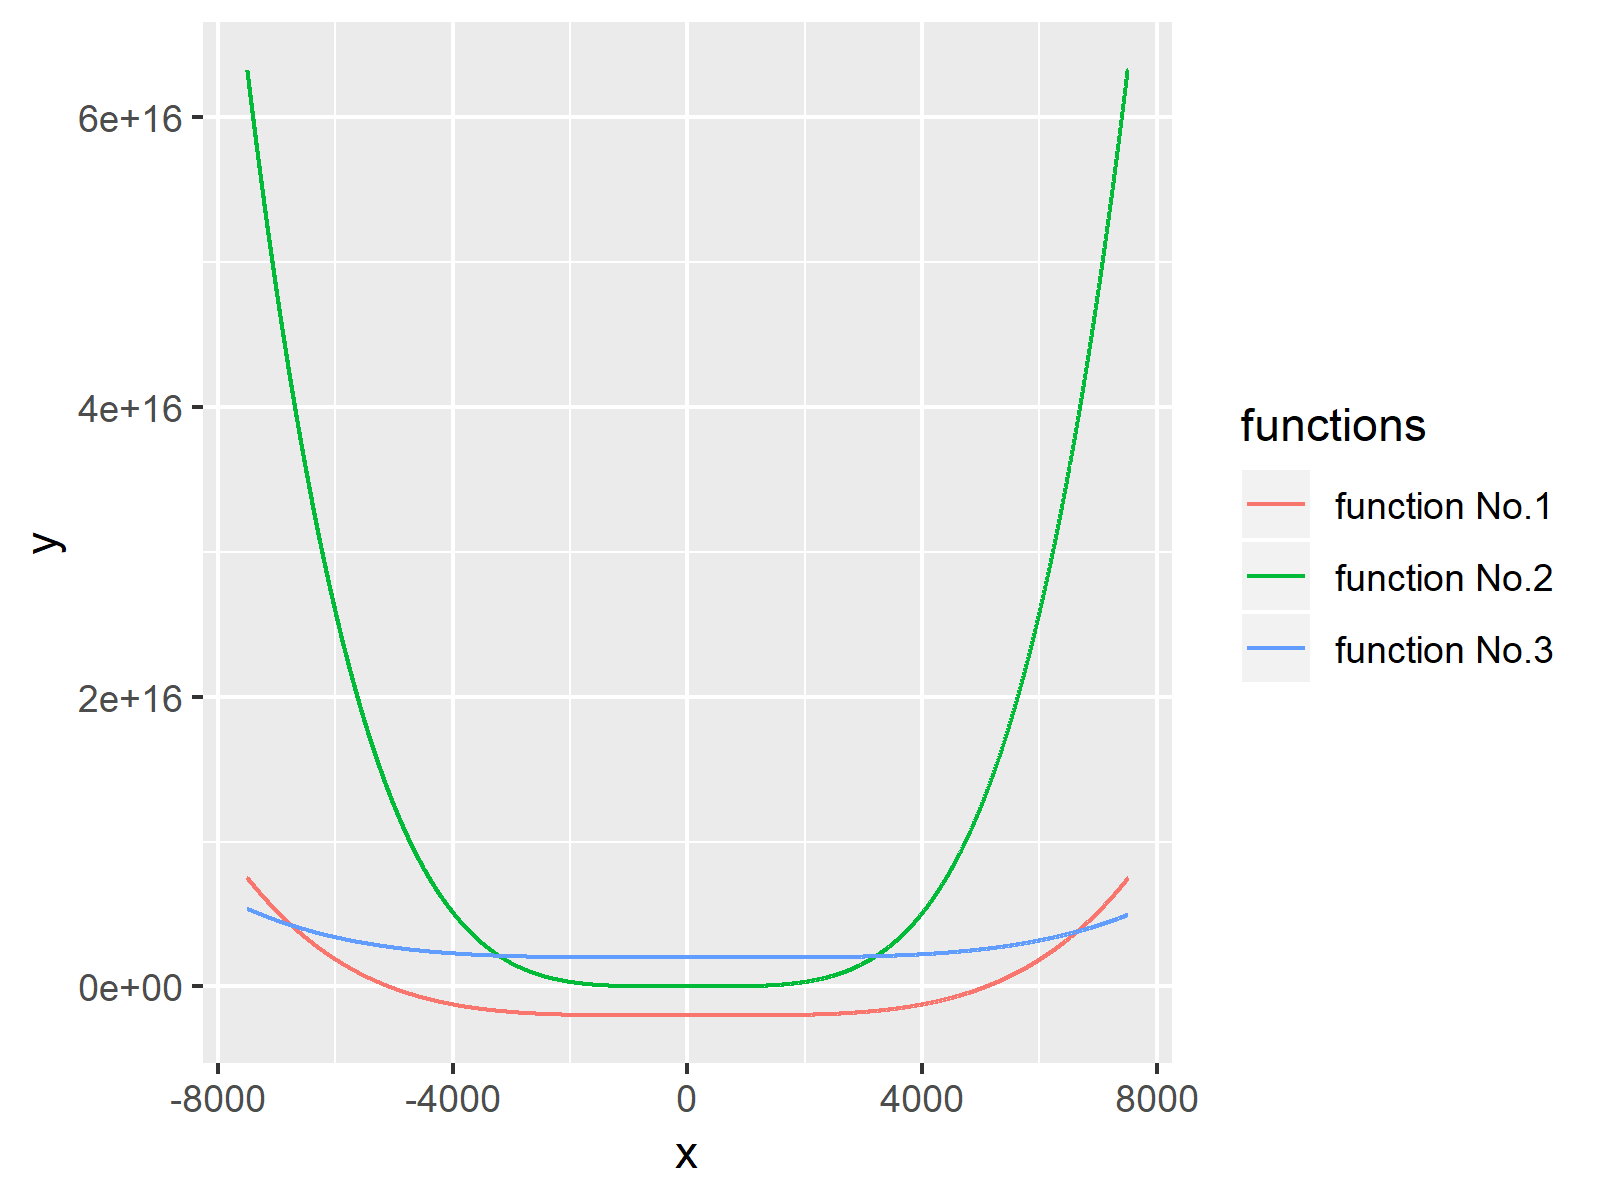
Example 2: Using ggplot2 Package to Draw Several Curves to Same Plot
install.packages("ggplot2") # Install ggplot2 package library("ggplot2") # Load ggplot2 package |
install.packages("ggplot2") # Install ggplot2 package library("ggplot2") # Load ggplot2 package
data_fn <- data.frame(x = - 7500:7500, # Constructing data frame y = c(fn_1(- 7500:7500), fn_2(- 7500:7500), fn_3(- 7500:7500)), functions = rep(c("function No.1", "function No.2", "function No.3"), each = 15001)) |
data_fn <- data.frame(x = - 7500:7500, # Constructing data frame y = c(fn_1(- 7500:7500), fn_2(- 7500:7500), fn_3(- 7500:7500)), functions = rep(c("function No.1", "function No.2", "function No.3"), each = 15001))
ggplot(data_fn, # Plotting curves with ggplot2 aes(x = x, y = y, col = functions)) + geom_line() |
ggplot(data_fn, # Plotting curves with ggplot2 aes(x = x, y = y, col = functions)) + geom_line()

Related Tutorials & Further Resources
In the following, you may find some additional resources on topics such as lines, variables, and graphics in R.
