R How to Plot Several lattice Graphics in the Same Grid (Example Code)
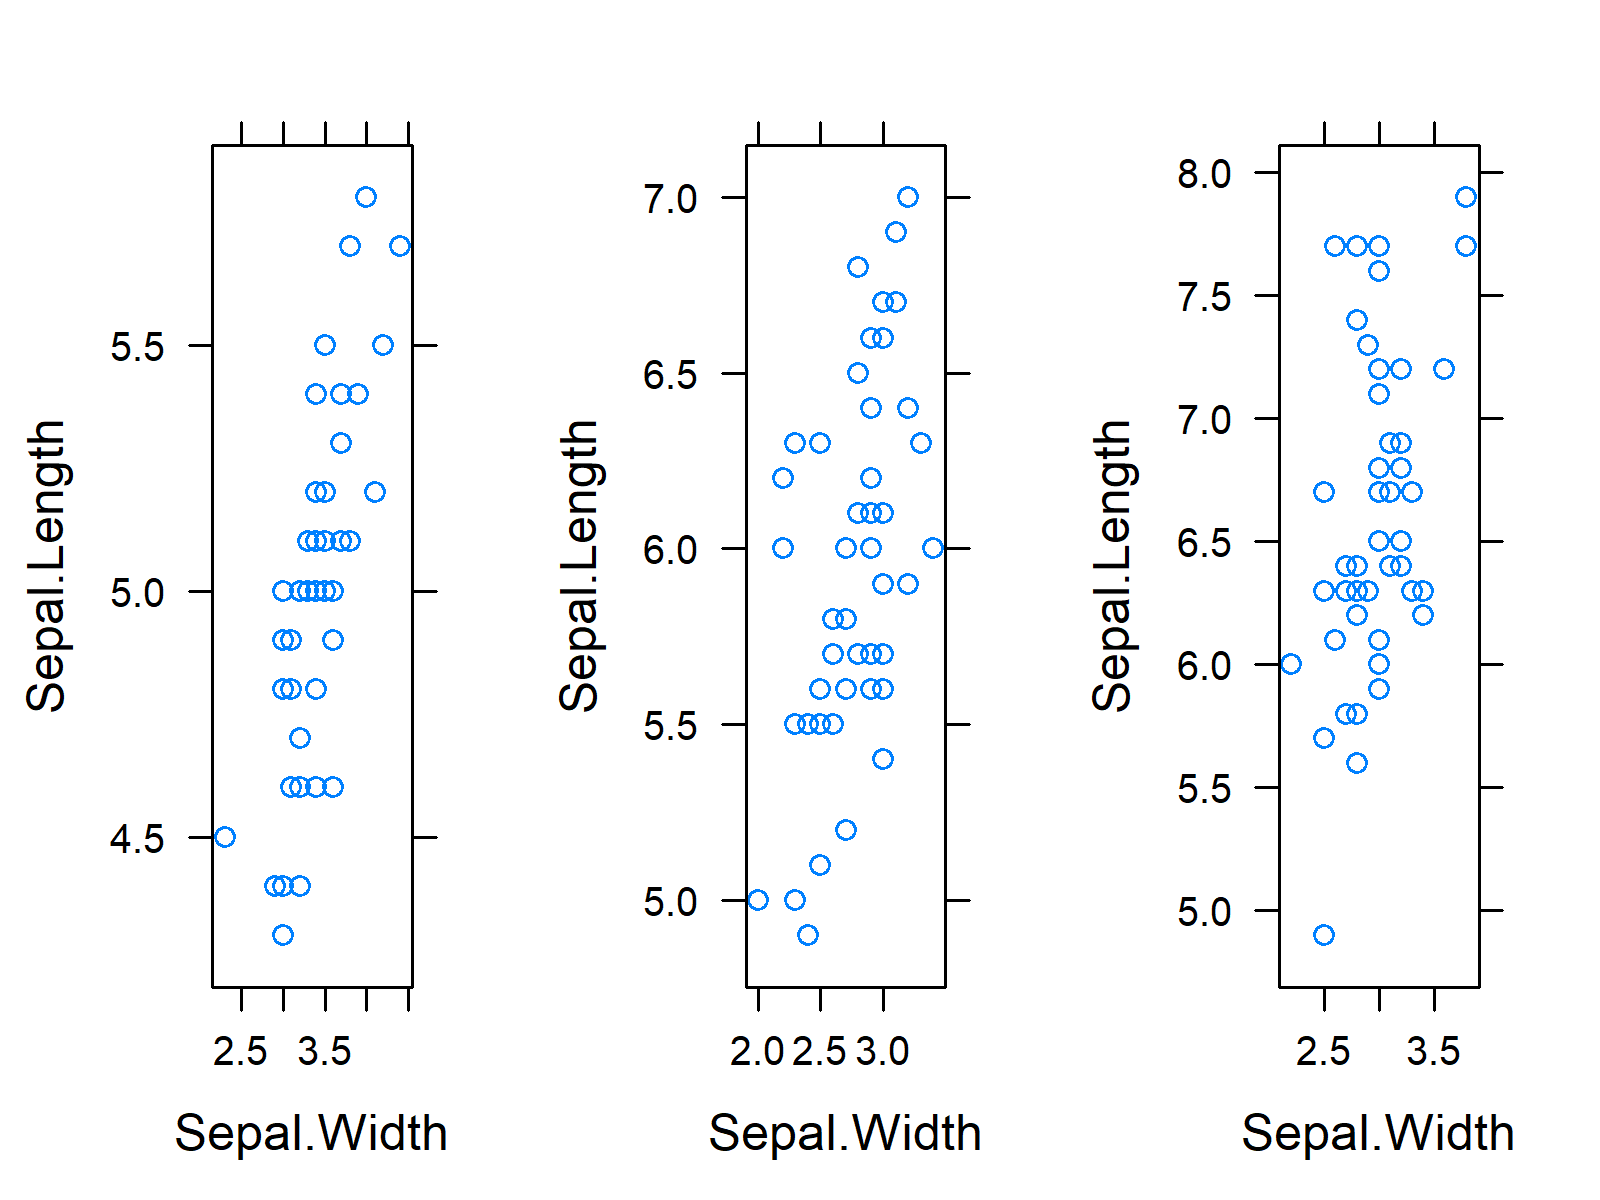
On this page, I’ll show how to draw multiple lattice plots in the same grid of plots in the R programming language.
Setting up the Example
data(iris) # Load iris head(iris) # Sepal.Length Sepal.Width Petal.Length Petal.Width Species # 1 5.1 3.5 1.4 0.2 setosa # 2 4.9 3.0 1.4 0.2 setosa # 3 4.7 3.2 1.3 0.2 setosa # 4 4.6 3.1 1.5 0.2 setosa # 5 5.0 3.6 1.4 0.2 setosa # 6 5.4 3.9 1.7 0.4 setosa |
data(iris) # Load iris head(iris) # Sepal.Length Sepal.Width Petal.Length Petal.Width Species # 1 5.1 3.5 1.4 0.2 setosa # 2 4.9 3.0 1.4 0.2 setosa # 3 4.7 3.2 1.3 0.2 setosa # 4 4.6 3.1 1.5 0.2 setosa # 5 5.0 3.6 1.4 0.2 setosa # 6 5.4 3.9 1.7 0.4 setosa
Example: Plotting Multiple lattice Graphics in One Grid
install.packages("lattice") # Install lattice package library("lattice") # Load lattice package |
install.packages("lattice") # Install lattice package library("lattice") # Load lattice package
iris_plot_1 <- xyplot(Sepal.Length ~ Sepal.Width, iris[iris$Species == "setosa", ]) # Creating lattice plots iris_plot_2 <- xyplot(Sepal.Length ~ Sepal.Width, iris[iris$Species == "versicolor", ]) iris_plot_3 <- xyplot(Sepal.Length ~ Sepal.Width, iris[iris$Species == "virginica", ]) |
iris_plot_1 <- xyplot(Sepal.Length ~ Sepal.Width, iris[iris$Species == "setosa", ]) # Creating lattice plots iris_plot_2 <- xyplot(Sepal.Length ~ Sepal.Width, iris[iris$Species == "versicolor", ]) iris_plot_3 <- xyplot(Sepal.Length ~ Sepal.Width, iris[iris$Species == "virginica", ])
install.packages("gridExtra") # Install gridExtra package library("gridExtra") # Load gridExtra package |
install.packages("gridExtra") # Install gridExtra package library("gridExtra") # Load gridExtra package
grid.arrange(iris_plot_1, # Draw grid of plots using grid.arrang iris_plot_2, iris_plot_3, ncol = 3) |
grid.arrange(iris_plot_1, # Draw grid of plots using grid.arrang iris_plot_2, iris_plot_3, ncol = 3)

