How to Modify Colors of Axis Labels & Values in Base R Graph (Example Code)
In this R programming post you’ll learn how to adjust axis colors in a plot.
Creating Example Data
data(iris) # Loading example data frame head(iris) # Sepal.Length Sepal.Width Petal.Length Petal.Width Species # 1 5.1 3.5 1.4 0.2 setosa # 2 4.9 3.0 1.4 0.2 setosa # 3 4.7 3.2 1.3 0.2 setosa # 4 4.6 3.1 1.5 0.2 setosa # 5 5.0 3.6 1.4 0.2 setosa # 6 5.4 3.9 1.7 0.4 setosa |
data(iris) # Loading example data frame head(iris) # Sepal.Length Sepal.Width Petal.Length Petal.Width Species # 1 5.1 3.5 1.4 0.2 setosa # 2 4.9 3.0 1.4 0.2 setosa # 3 4.7 3.2 1.3 0.2 setosa # 4 4.6 3.1 1.5 0.2 setosa # 5 5.0 3.6 1.4 0.2 setosa # 6 5.4 3.9 1.7 0.4 setosa
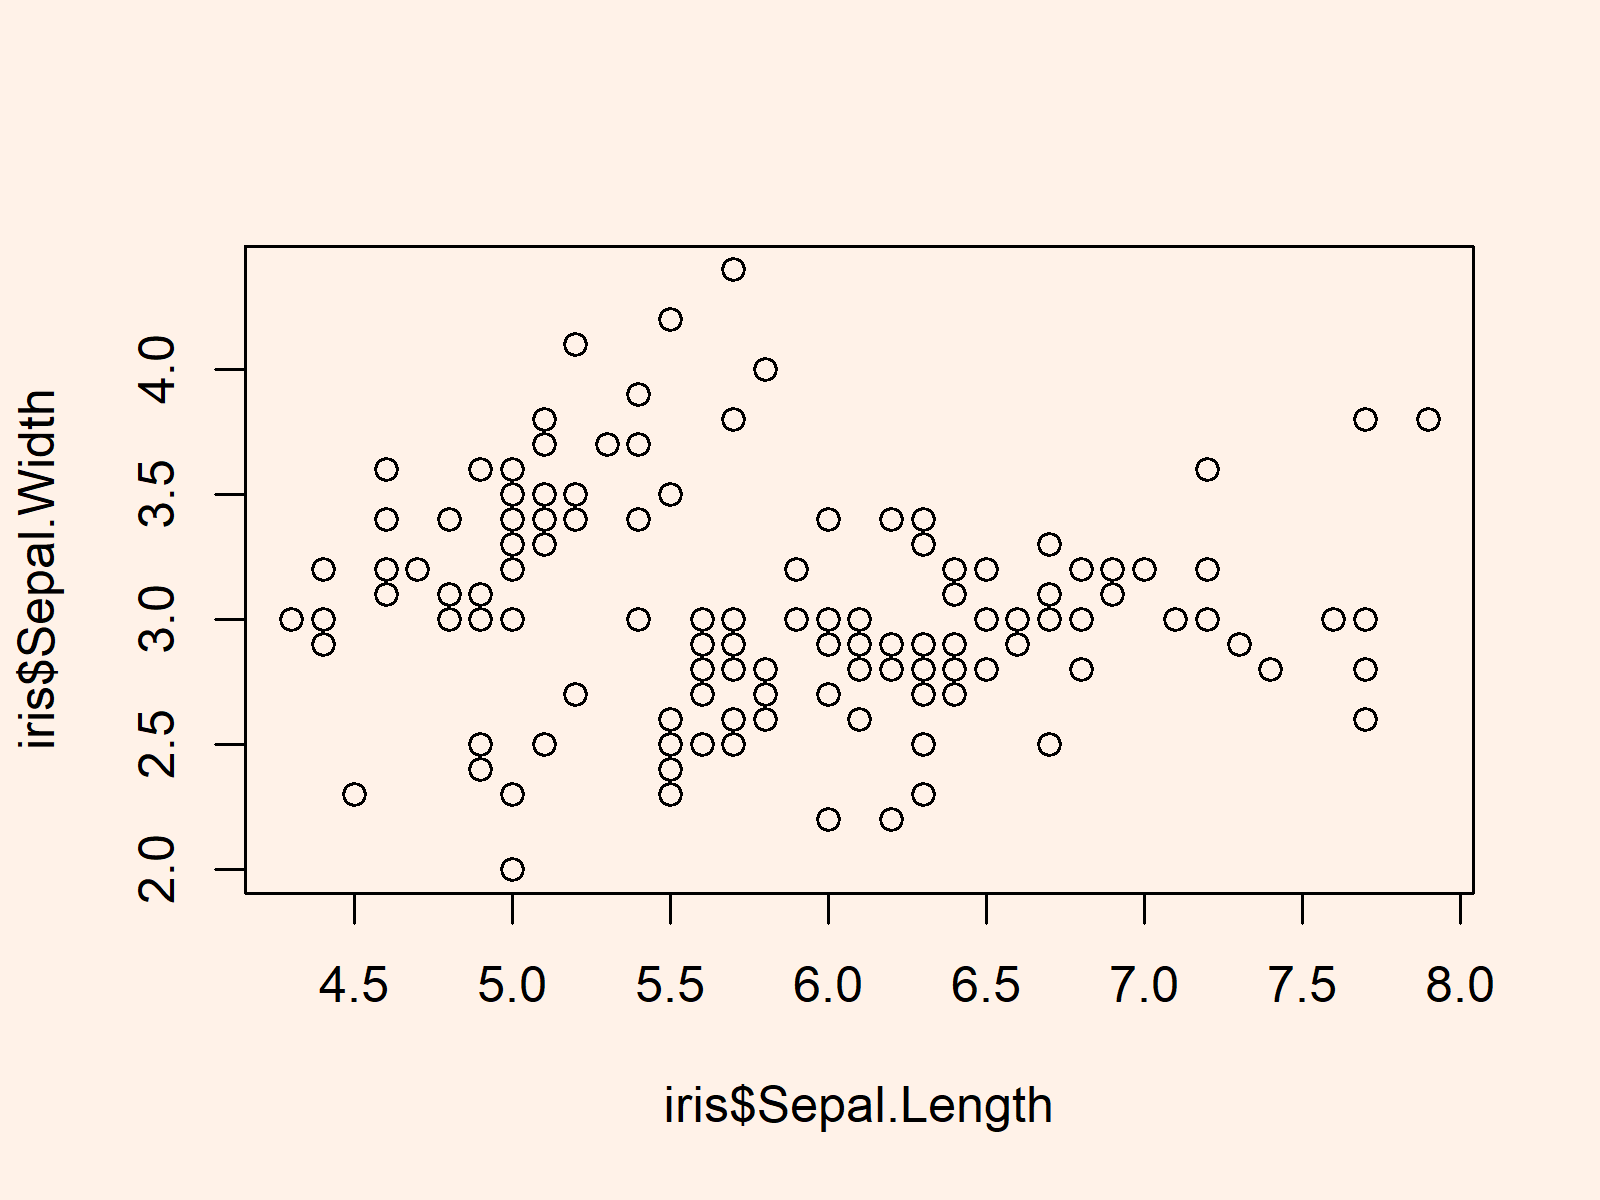
plot(iris$Sepal.Length, # Draw graph in black iris$Sepal.Width) |
plot(iris$Sepal.Length, # Draw graph in black iris$Sepal.Width)

Example: Modify Colors of Axis Labels & Values Using col.lab & col.axis Arguments
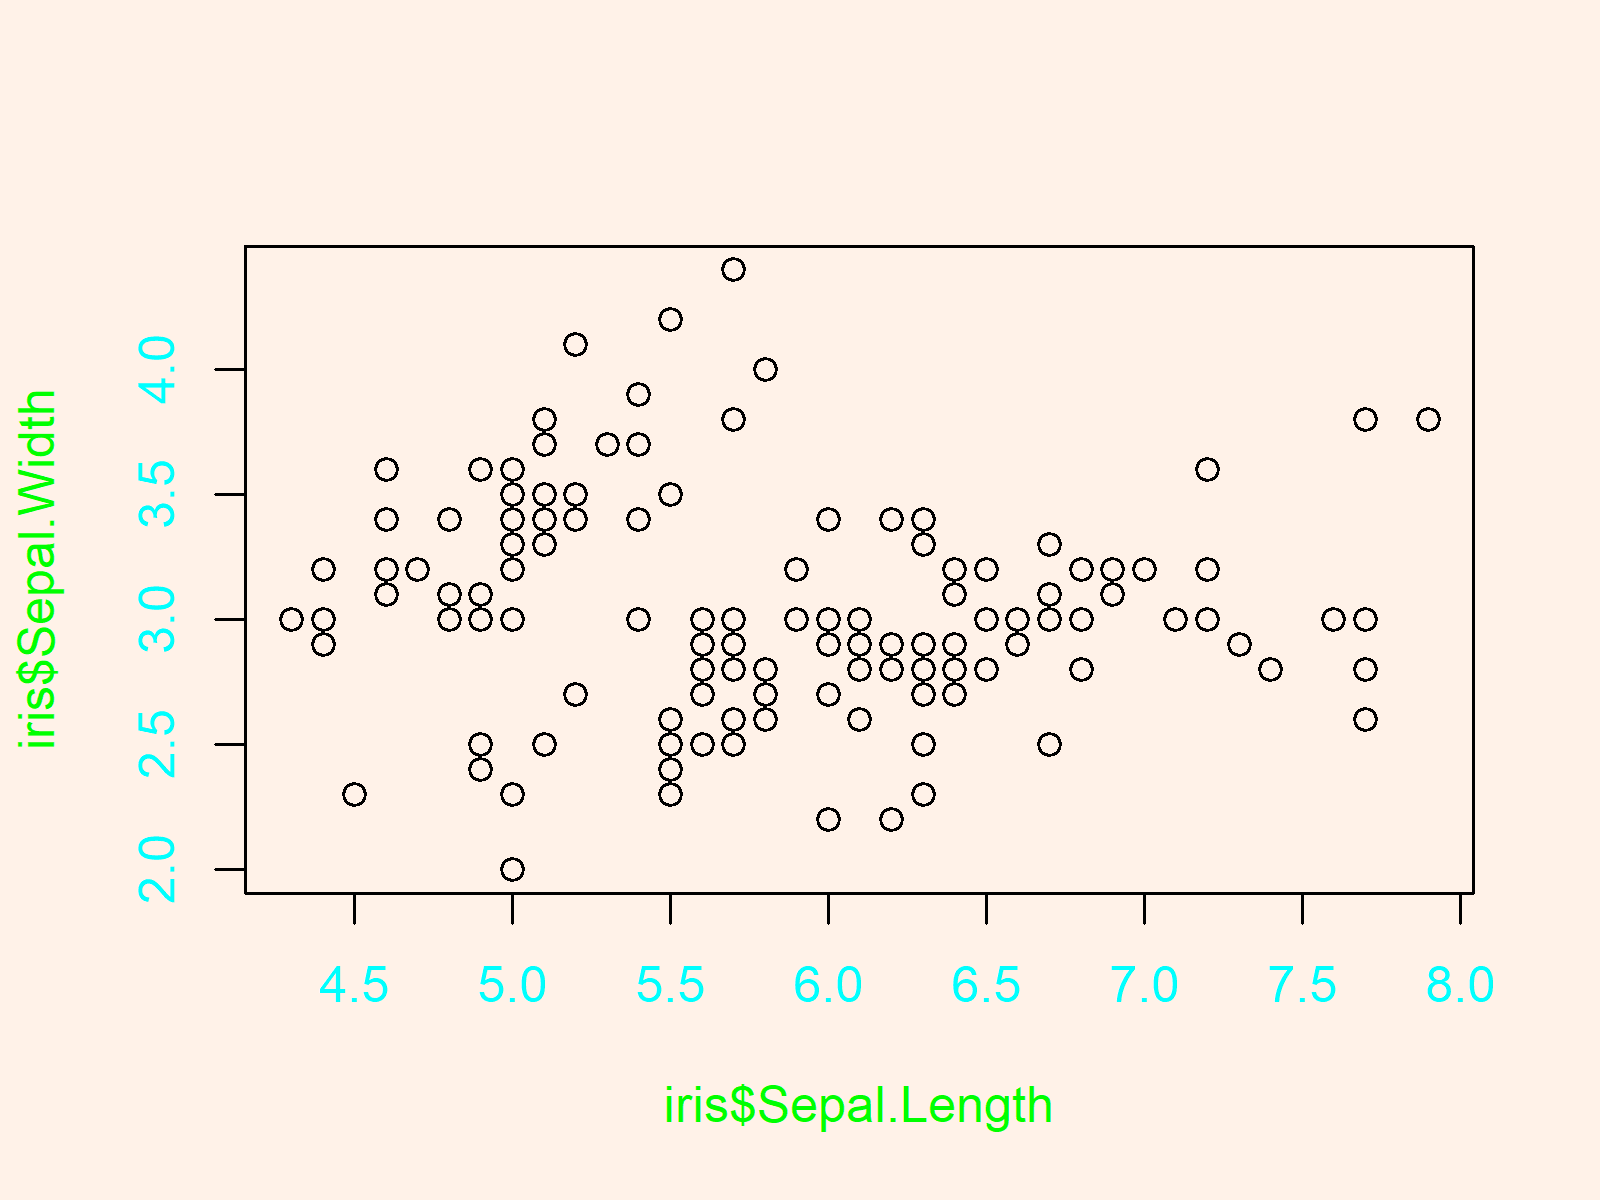
plot(iris$Sepal.Length, # Draw graph with manual axis colors iris$Sepal.Width, col.lab = "green", # Change color of axis labels col.axis = "cyan") # Change color of axis values |
plot(iris$Sepal.Length, # Draw graph with manual axis colors iris$Sepal.Width, col.lab = "green", # Change color of axis labels col.axis = "cyan") # Change color of axis values

Related Articles
You may find some related R programming tutorials on topics such as ggplot2, plot legends, and graphics in R in the following list.
