How to Plot a Circle in R (Example Code)
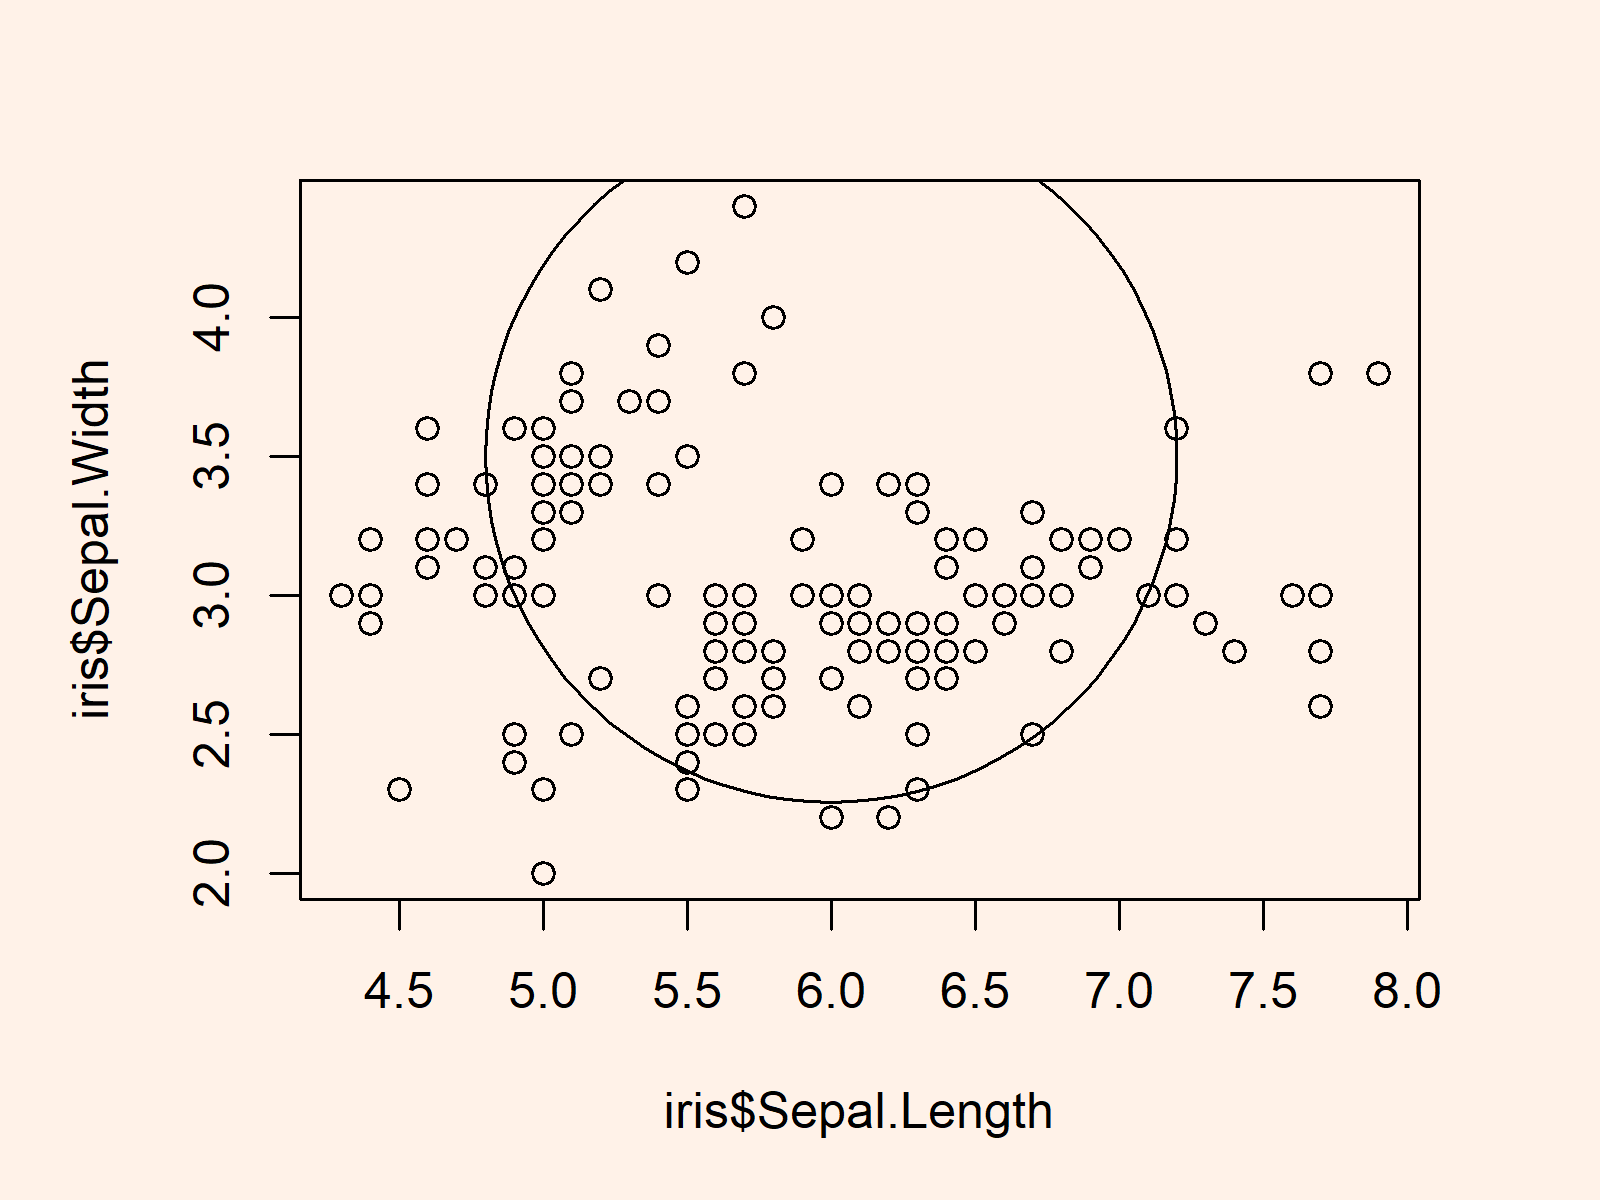
In this R article you’ll learn how to draw a plot with circles.
Create Example Data for Plot
data(iris) # Example data head(iris) # Sepal.Length Sepal.Width Petal.Length Petal.Width Species # 1 5.1 3.5 1.4 0.2 setosa # 2 4.9 3.0 1.4 0.2 setosa # 3 4.7 3.2 1.3 0.2 setosa # 4 4.6 3.1 1.5 0.2 setosa # 5 5.0 3.6 1.4 0.2 setosa # 6 5.4 3.9 1.7 0.4 setosa |
data(iris) # Example data head(iris) # Sepal.Length Sepal.Width Petal.Length Petal.Width Species # 1 5.1 3.5 1.4 0.2 setosa # 2 4.9 3.0 1.4 0.2 setosa # 3 4.7 3.2 1.3 0.2 setosa # 4 4.6 3.1 1.5 0.2 setosa # 5 5.0 3.6 1.4 0.2 setosa # 6 5.4 3.9 1.7 0.4 setosa
Example: Annotate Circle to Plot Using Base R & plotrix Package
install.packages("plotrix") # Install & load plotrix library("plotrix") |
install.packages("plotrix") # Install & load plotrix library("plotrix")
plot(iris$Sepal.Length, # Plot with circle iris$Sepal.Width) draw.circle(6, 3.5, 1.2) |
plot(iris$Sepal.Length, # Plot with circle iris$Sepal.Width) draw.circle(6, 3.5, 1.2)

Related Articles
You may find some related R tutorials in the following list:
