Change Transparency of ggplot2 Plot Legend Items in R (Example Code)
This article shows how to adjust the transparency of ggplot2 legend items in R programming.
Preparing the Example
data(iris) # Load and inspect iris data head(iris) # Sepal.Length Sepal.Width Petal.Length Petal.Width Species # 1 5.1 3.5 1.4 0.2 setosa # 2 4.9 3.0 1.4 0.2 setosa # 3 4.7 3.2 1.3 0.2 setosa # 4 4.6 3.1 1.5 0.2 setosa # 5 5.0 3.6 1.4 0.2 setosa # 6 5.4 3.9 1.7 0.4 setosa |
data(iris) # Load and inspect iris data head(iris) # Sepal.Length Sepal.Width Petal.Length Petal.Width Species # 1 5.1 3.5 1.4 0.2 setosa # 2 4.9 3.0 1.4 0.2 setosa # 3 4.7 3.2 1.3 0.2 setosa # 4 4.6 3.1 1.5 0.2 setosa # 5 5.0 3.6 1.4 0.2 setosa # 6 5.4 3.9 1.7 0.4 setosa
install.packages("ggplot2") # Install ggplot2 package library("ggplot2") # Load ggplot2 package |
install.packages("ggplot2") # Install ggplot2 package library("ggplot2") # Load ggplot2 package
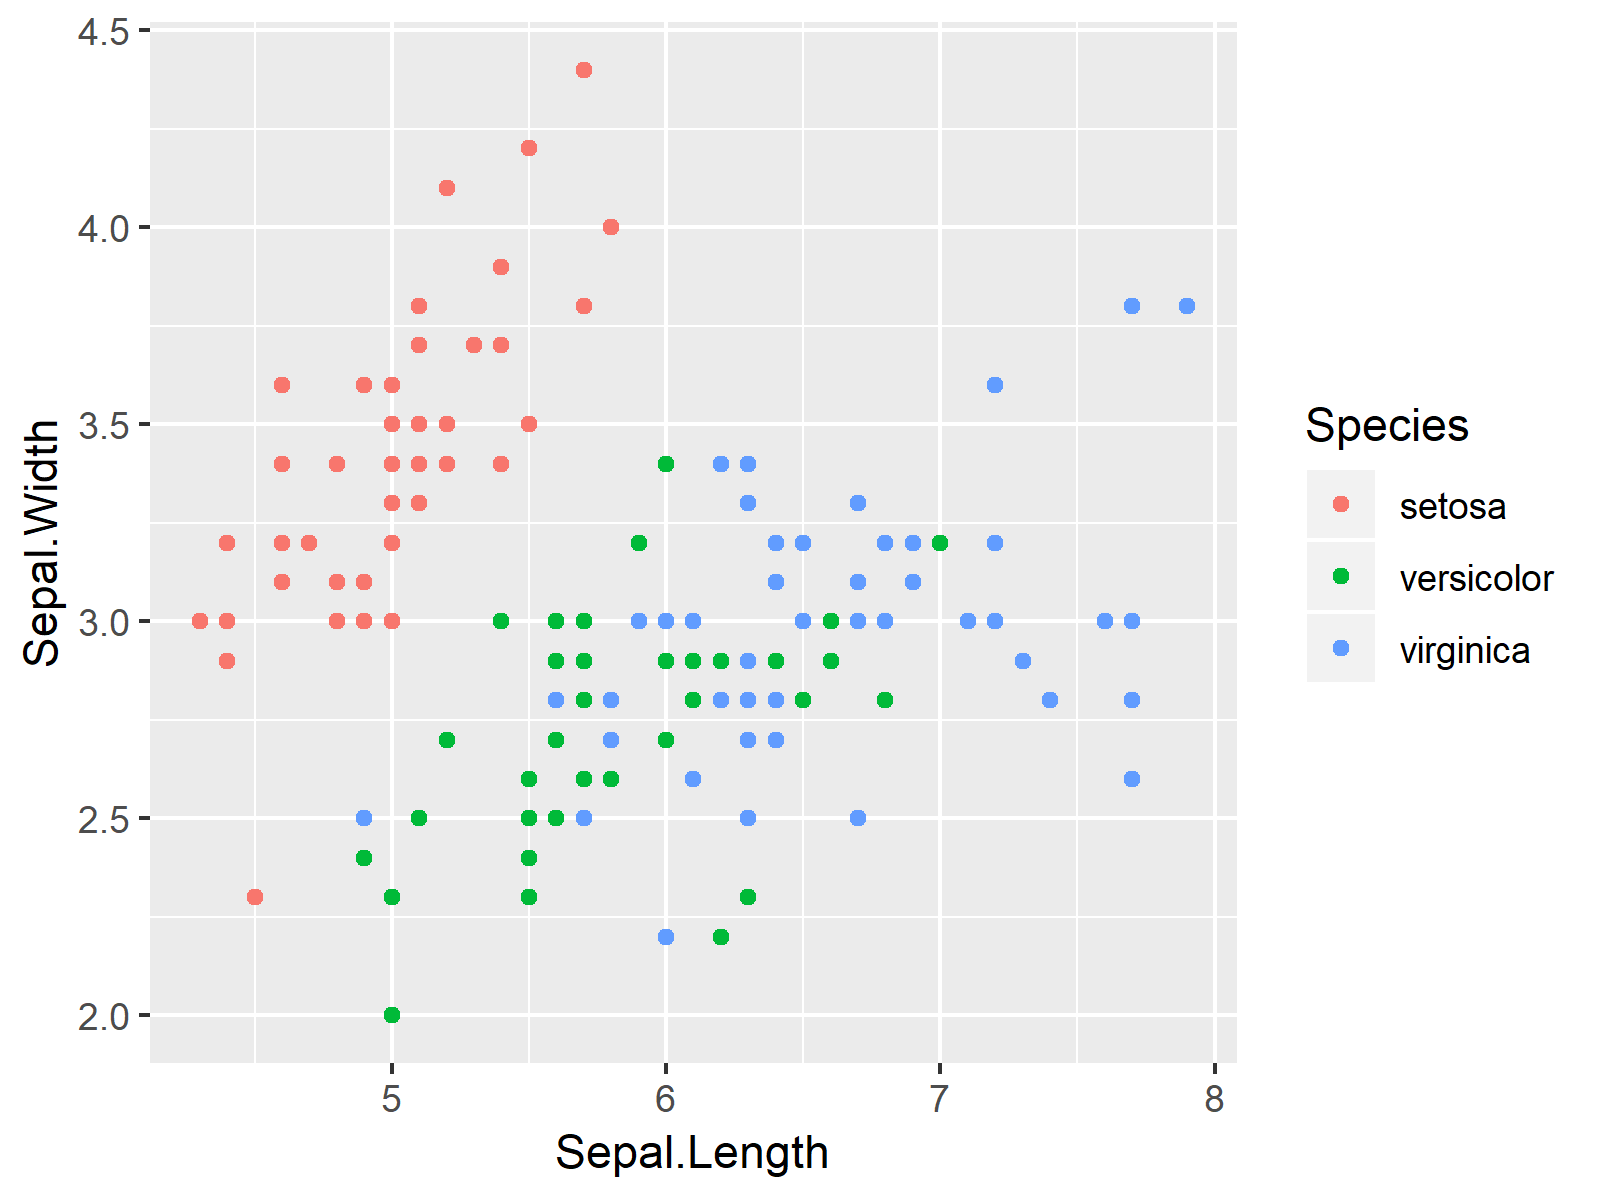
my_plot <- ggplot(iris, aes(x = Sepal.Length, # Default ggplot2 graph y = Sepal.Width, colour = Species)) + geom_point() my_plot # Drawing graph |
my_plot <- ggplot(iris, aes(x = Sepal.Length, # Default ggplot2 graph y = Sepal.Width, colour = Species)) + geom_point() my_plot # Drawing graph

Example: Decreasing Legend Alpha of ggplot2 Graphic in R
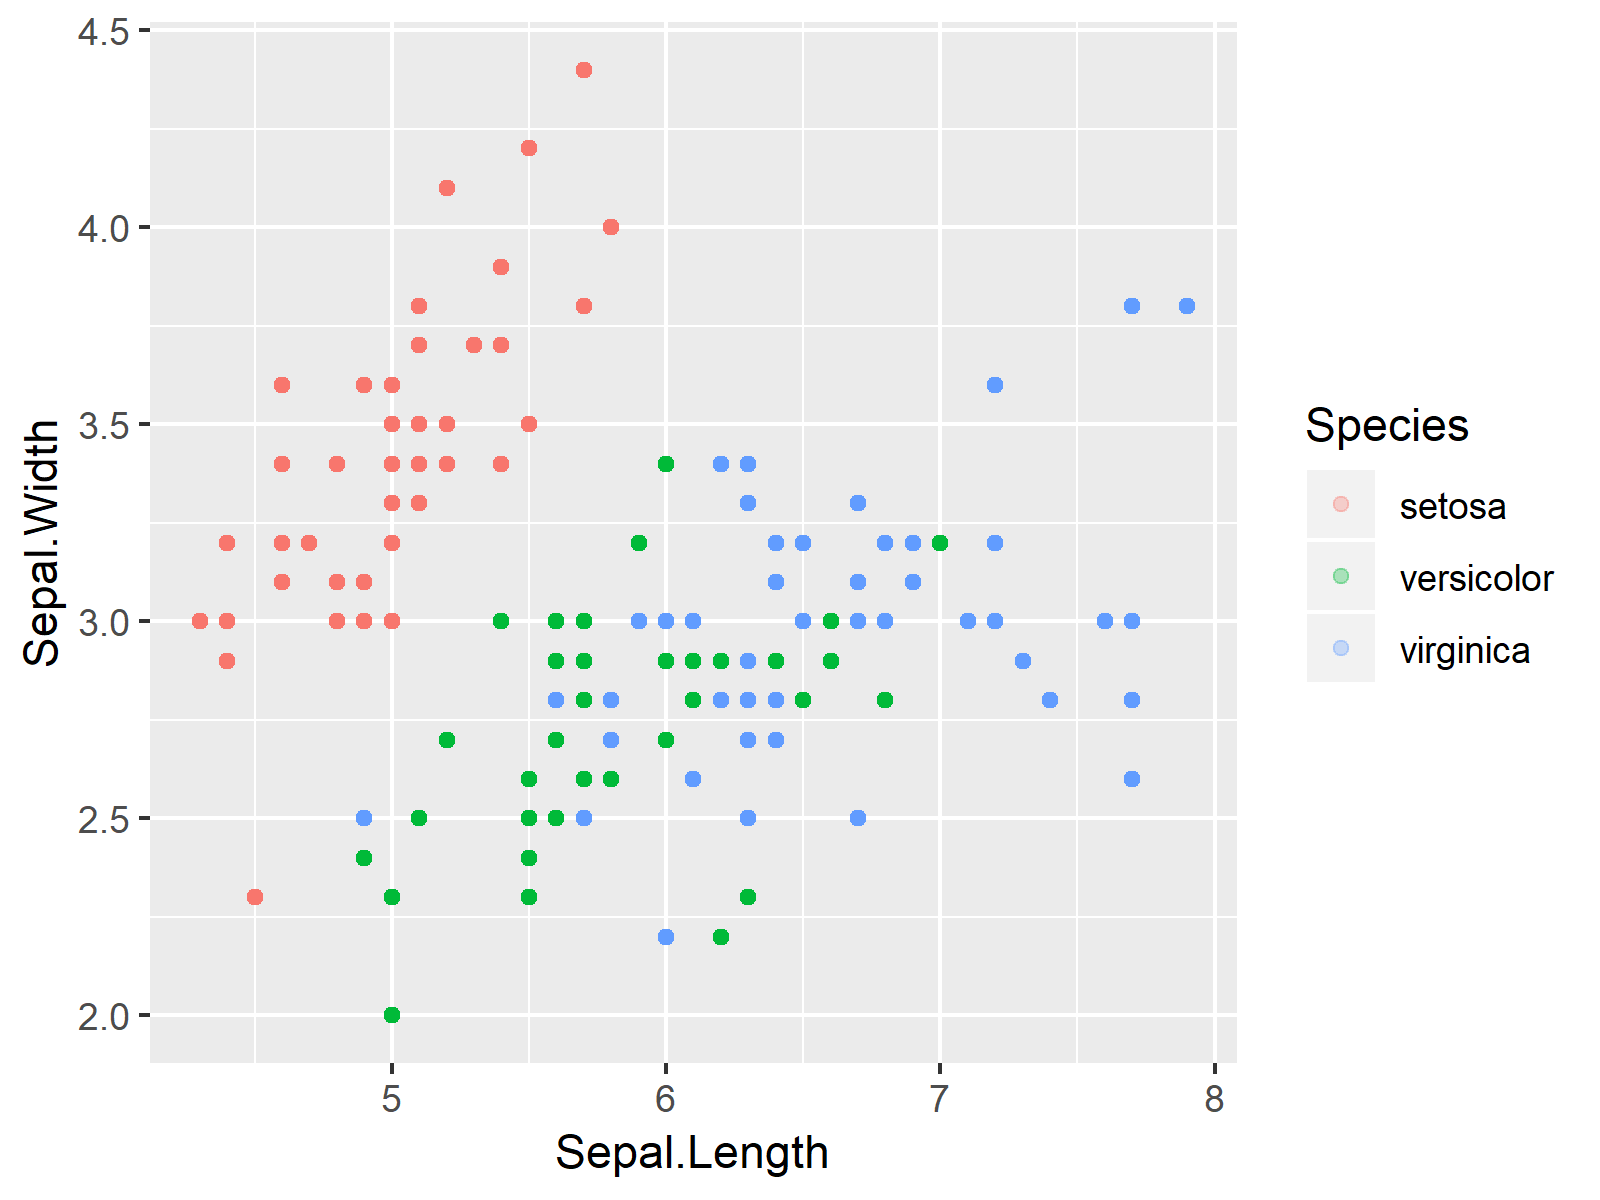
my_plot + # Modifying alpha of legend items guides(colour = guide_legend( override.aes = list(alpha = 0.3))) |
my_plot + # Modifying alpha of legend items guides(colour = guide_legend( override.aes = list(alpha = 0.3)))

