How to Modify the Space Between Axis Tick Marks of a Plot in Base R (2 Examples)
In this tutorial you’ll learn how to modify the space between axis ticks of a Base R plot in R programming.
Creation of Example Data
set.seed(34756) # Example data x <- rnorm(1000) y <- rnorm(1000) + 0.5 * x |
set.seed(34756) # Example data x <- rnorm(1000) y <- rnorm(1000) + 0.5 * x
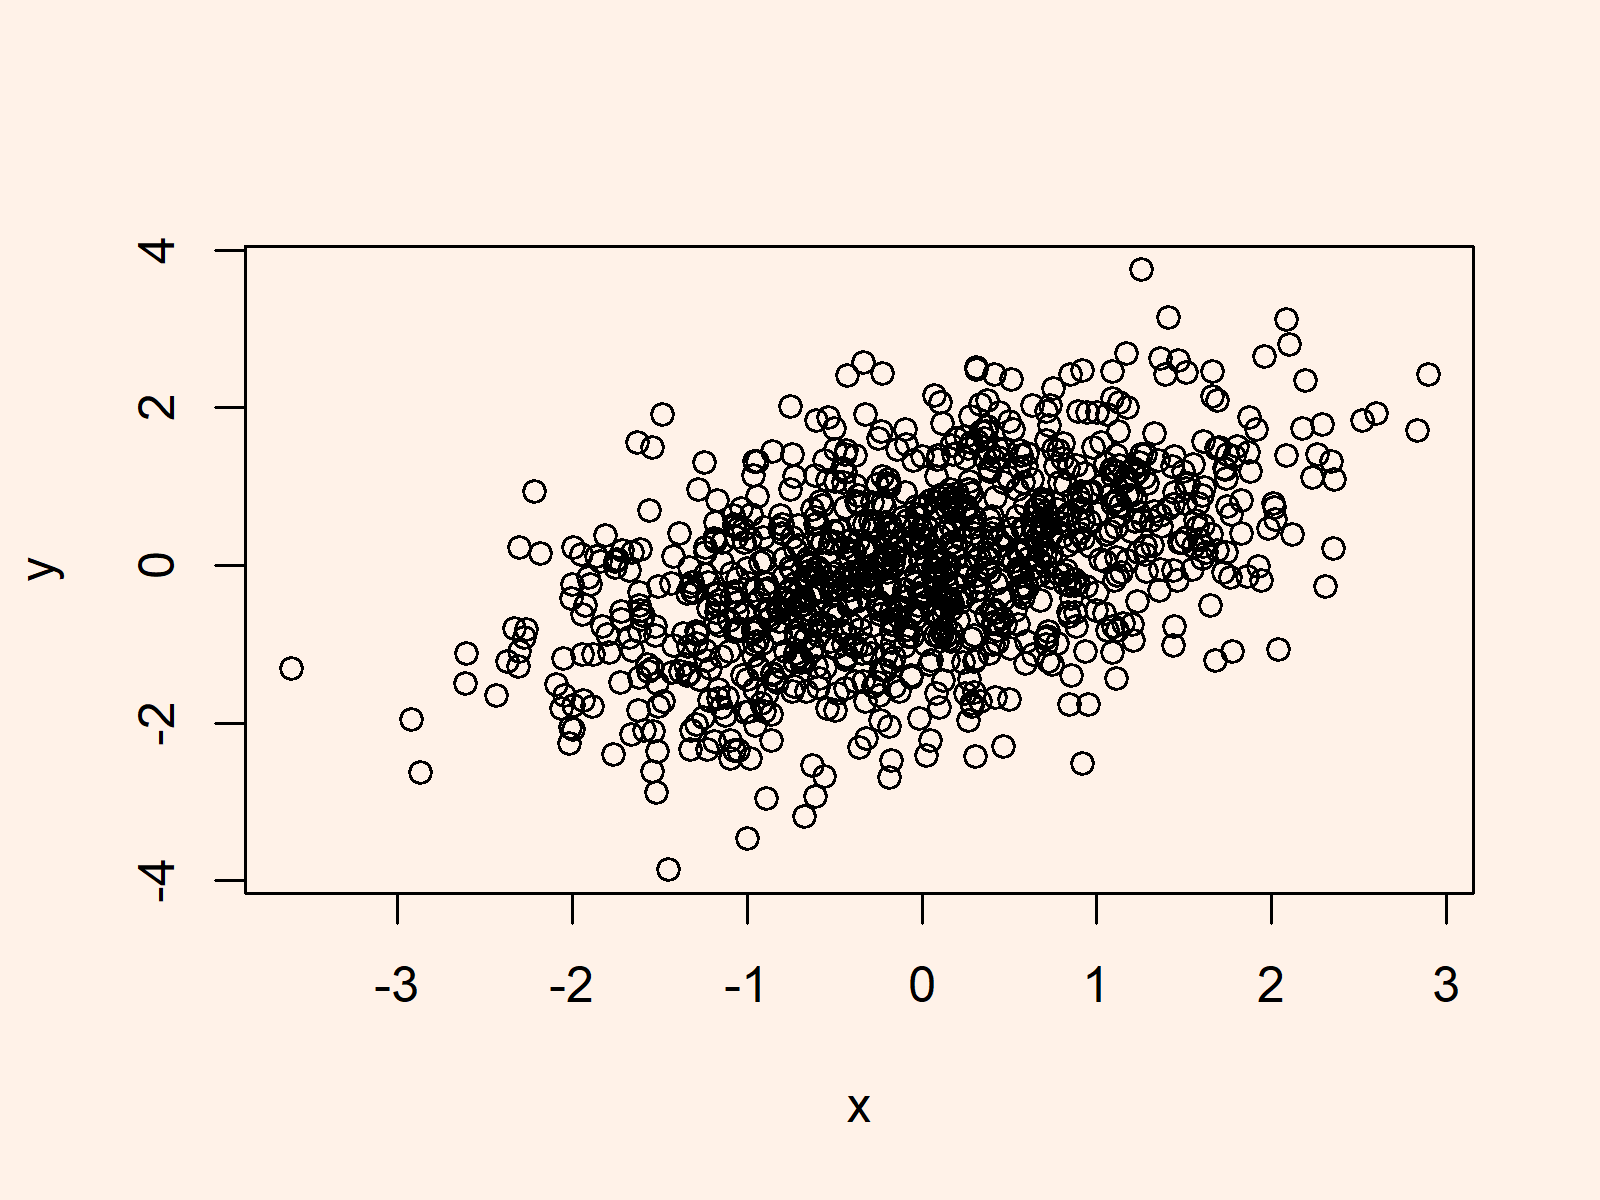
plot(x, y) # Basic R plot |
plot(x, y) # Basic R plot

Example 1: Manually Modify Positions of Axis Tick Marks Based On axis() Function
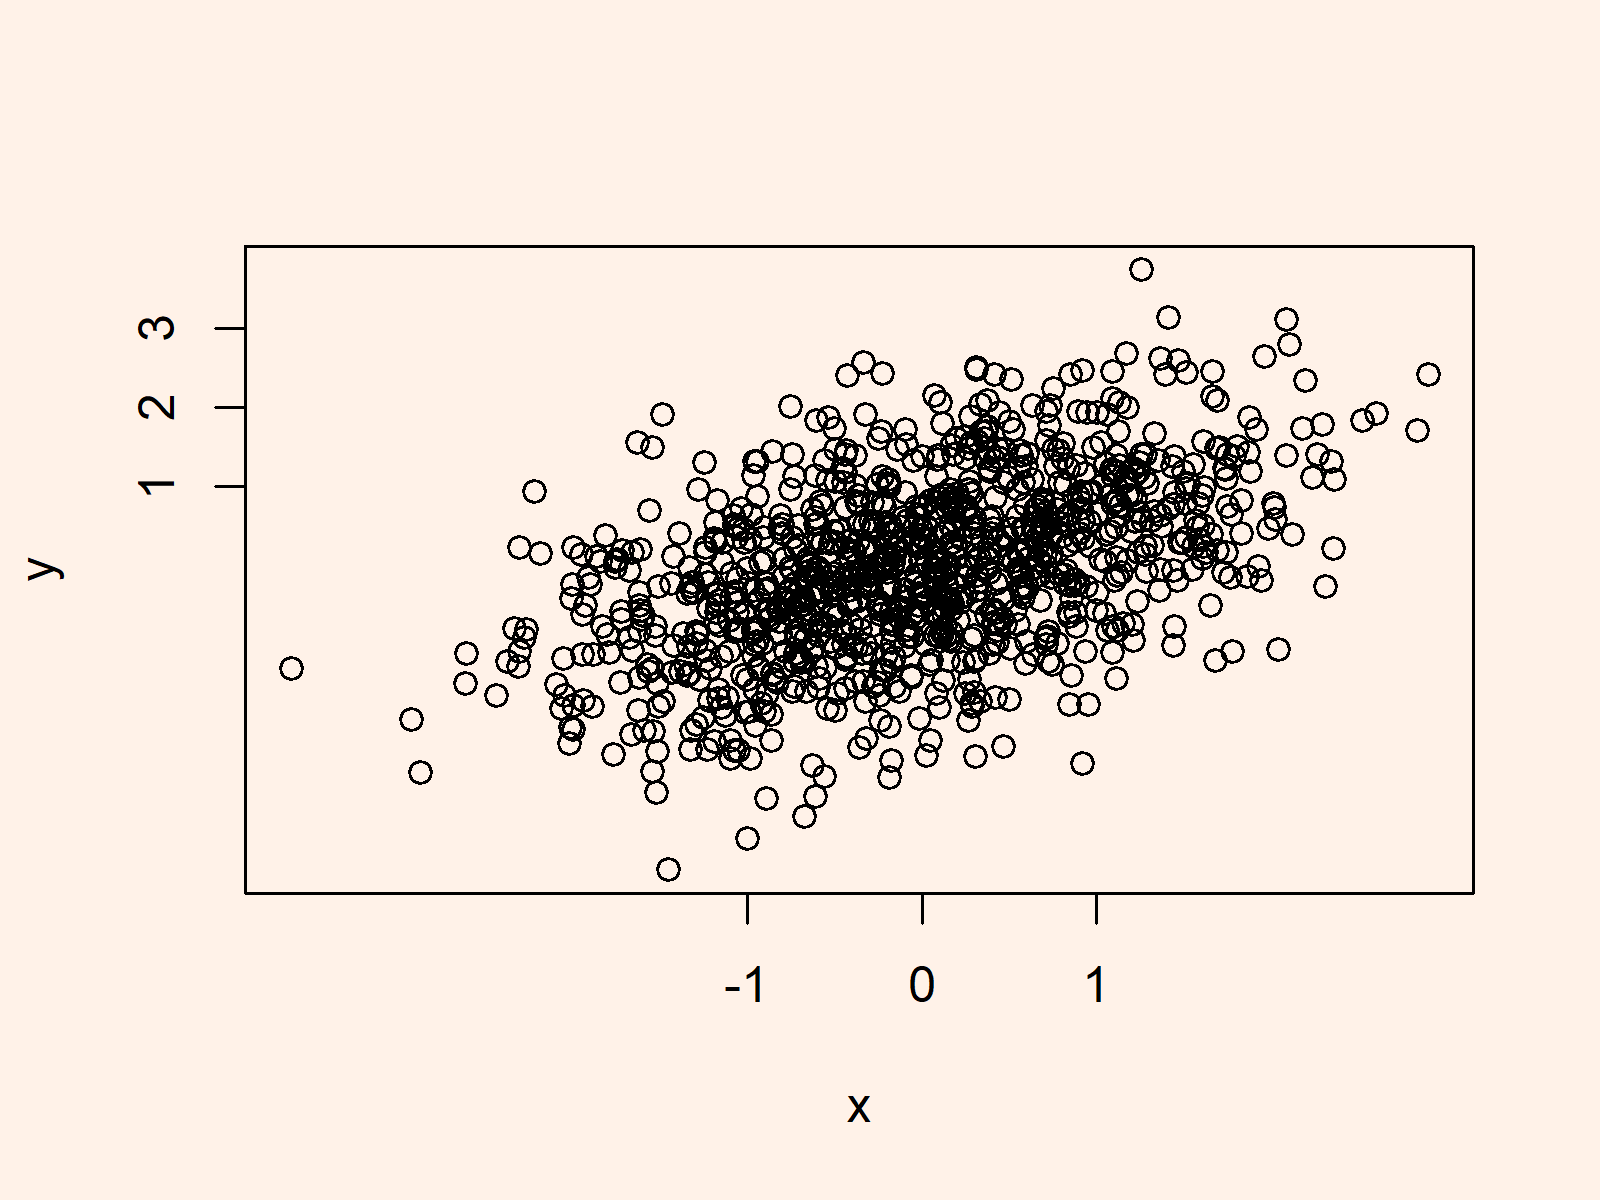
plot(x, y, # Apply plot function xaxt = "n", yaxt = "n") axis(side = 1, at = c(- 1, 0, 1)) # Apply axis function to x-axis axis(side = 2, at = 1:3) # Apply axis function to y-axis |
plot(x, y, # Apply plot function xaxt = "n", yaxt = "n") axis(side = 1, at = c(- 1, 0, 1)) # Apply axis function to x-axis axis(side = 2, at = 1:3) # Apply axis function to y-axis

Example 2: Manually Modify Positions of Axis Tick Marks Based On xaxp & yaxp
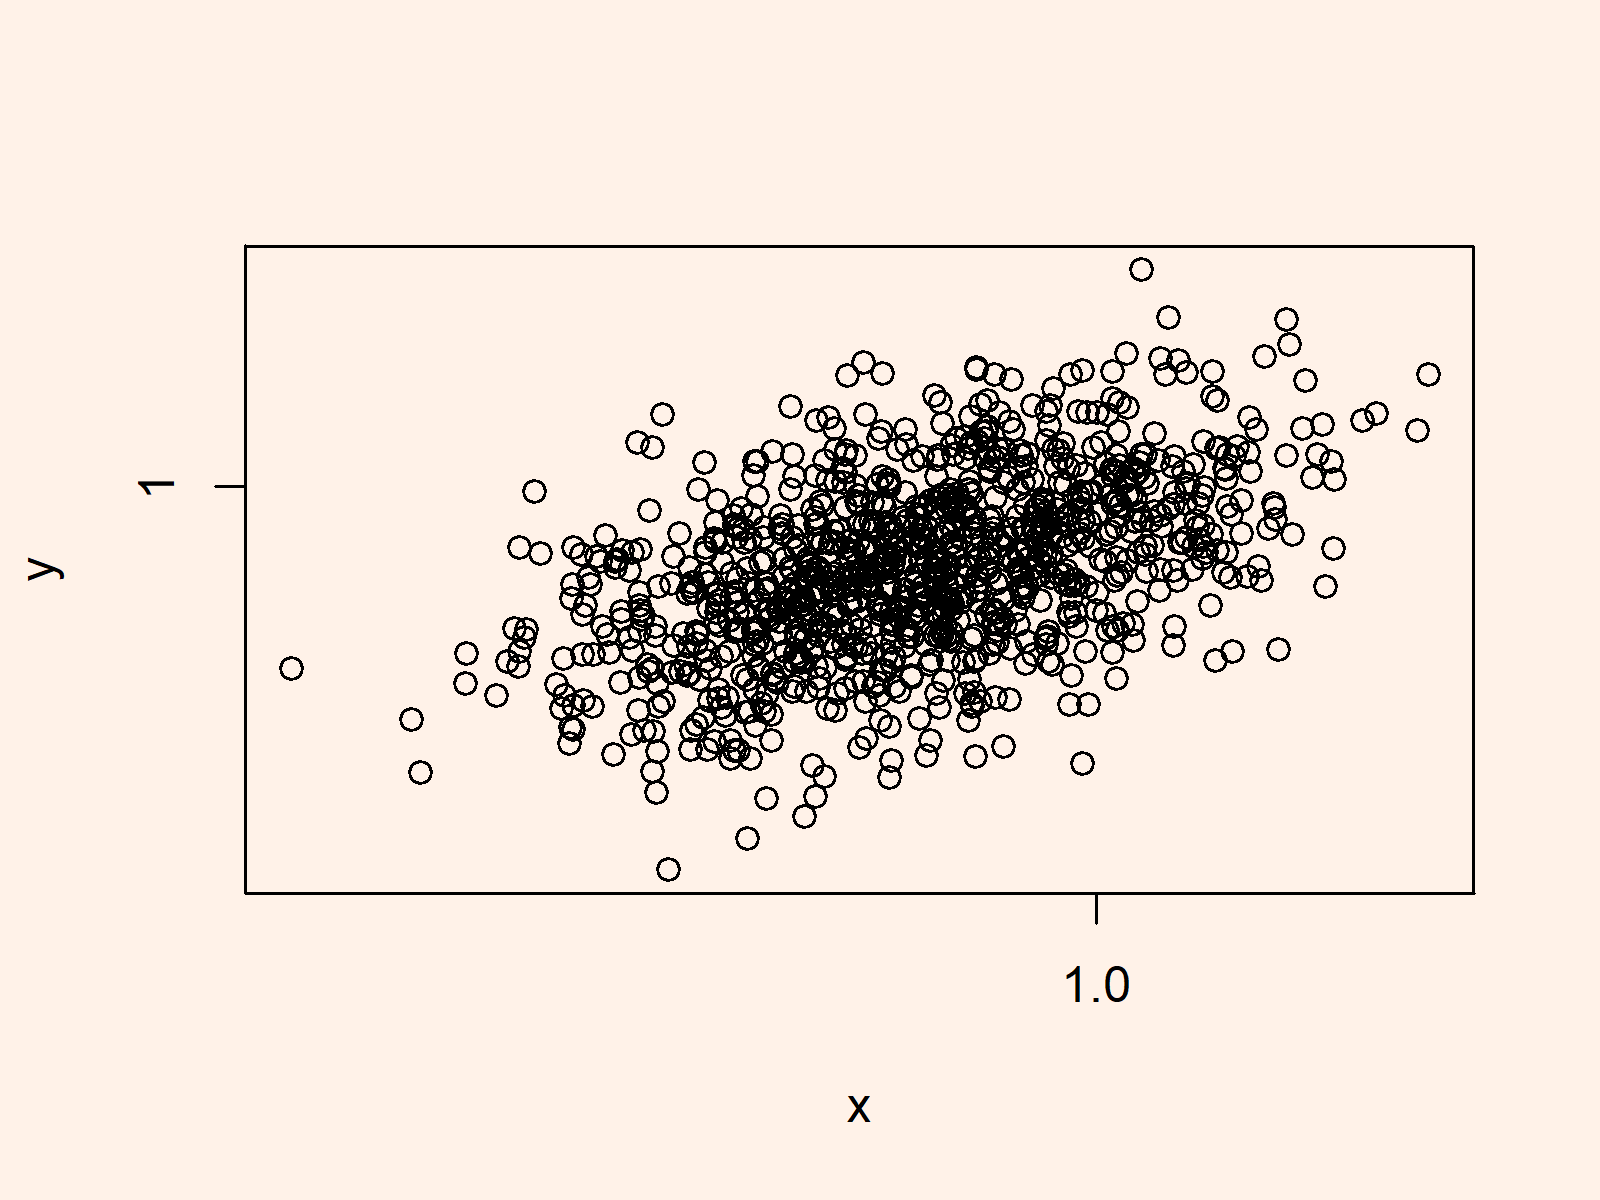
plot(x, y, # Plot data with axes specified by xaxp & yaxp xaxp = c(1, 100, 5), yaxp = c(1, 100, 9)) |
plot(x, y, # Plot data with axes specified by xaxp & yaxp xaxp = c(1, 100, 5), yaxp = c(1, 100, 9))

