R How to Plot Data with Confidence Intervals Using ggplot2 Package (Example Code)
In this article you’ll learn how to plot a data frame with confidence intervals using the ggplot2 package in R programming.
Setting up the Example
set.seed(238764333) # Construct some random data df_CI <- data.frame(x_values = 1:25, y_values = runif(25, 1, 2), lower_CI = runif(25, 0, 1), upper_CI = runif(25, 2, 3)) df_CI # Show example data in RStudio console # x_values y_values lower_CI upper_CI # 1 1 1.497724 0.18452314 2.086016 # 2 2 1.205241 0.44810720 2.172153 # 3 3 1.677150 0.01113677 2.755956 # 4 4 1.944724 0.66876006 2.968620 # 5 5 1.210716 0.41809743 2.703515 # 6 6 1.576586 0.13839030 2.716492 # 7 7 1.434327 0.42954432 2.541105 # 8 8 1.329666 0.56201672 2.740719 # 9 9 1.624894 0.94046553 2.725235 # 10 10 1.999992 0.75788611 2.872872 # 11 11 1.076288 0.02126278 2.089156 # 12 12 1.698039 0.66717068 2.301000 # 13 13 1.149957 0.35207286 2.625906 # 14 14 1.212798 0.94494239 2.744084 # 15 15 1.547397 0.61135352 2.491838 # 16 16 1.387348 0.79431157 2.087978 # 17 17 1.279603 0.57946594 2.557548 # 18 18 1.534598 0.27164055 2.717535 # 19 19 1.686022 0.66113979 2.664230 # 20 20 1.677092 0.70238721 2.373479 # 21 21 1.942224 0.06481388 2.217472 # 22 22 1.629116 0.14106900 2.056812 # 23 23 1.413006 0.27121570 2.709895 # 24 24 1.701890 0.77305589 2.447095 # 25 25 1.019012 0.29547495 2.238710 |
set.seed(238764333) # Construct some random data df_CI <- data.frame(x_values = 1:25, y_values = runif(25, 1, 2), lower_CI = runif(25, 0, 1), upper_CI = runif(25, 2, 3)) df_CI # Show example data in RStudio console # x_values y_values lower_CI upper_CI # 1 1 1.497724 0.18452314 2.086016 # 2 2 1.205241 0.44810720 2.172153 # 3 3 1.677150 0.01113677 2.755956 # 4 4 1.944724 0.66876006 2.968620 # 5 5 1.210716 0.41809743 2.703515 # 6 6 1.576586 0.13839030 2.716492 # 7 7 1.434327 0.42954432 2.541105 # 8 8 1.329666 0.56201672 2.740719 # 9 9 1.624894 0.94046553 2.725235 # 10 10 1.999992 0.75788611 2.872872 # 11 11 1.076288 0.02126278 2.089156 # 12 12 1.698039 0.66717068 2.301000 # 13 13 1.149957 0.35207286 2.625906 # 14 14 1.212798 0.94494239 2.744084 # 15 15 1.547397 0.61135352 2.491838 # 16 16 1.387348 0.79431157 2.087978 # 17 17 1.279603 0.57946594 2.557548 # 18 18 1.534598 0.27164055 2.717535 # 19 19 1.686022 0.66113979 2.664230 # 20 20 1.677092 0.70238721 2.373479 # 21 21 1.942224 0.06481388 2.217472 # 22 22 1.629116 0.14106900 2.056812 # 23 23 1.413006 0.27121570 2.709895 # 24 24 1.701890 0.77305589 2.447095 # 25 25 1.019012 0.29547495 2.238710
install.packages("ggplot2") # Install & load ggplot2 package library("ggplot2") |
install.packages("ggplot2") # Install & load ggplot2 package library("ggplot2")
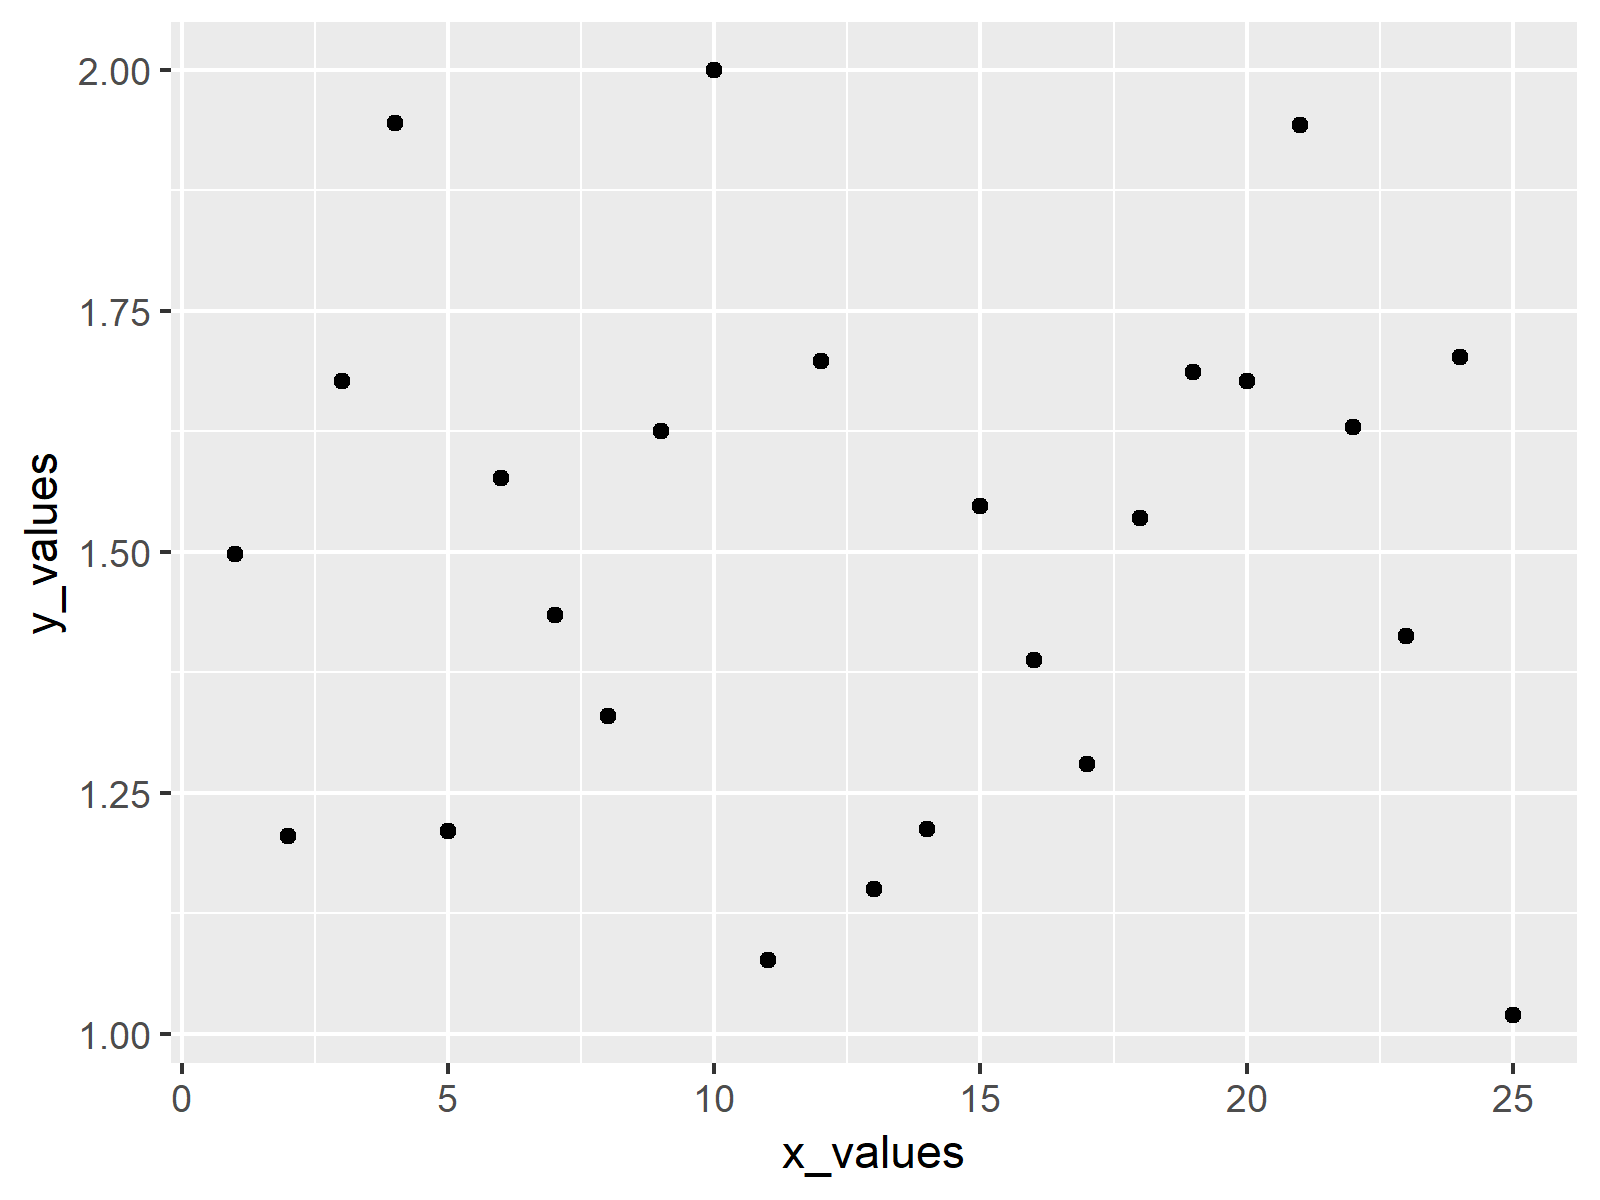
my_ggplot <- ggplot(df_CI, # Create default ggplot2 scatterplot aes(x = x_values, y = y_values)) + geom_point() my_ggplot # Draw plot in RStudio |
my_ggplot <- ggplot(df_CI, # Create default ggplot2 scatterplot aes(x = x_values, y = y_values)) + geom_point() my_ggplot # Draw plot in RStudio

Example: Create ggplot2 Plot with Lower & Upper Confidence Intervals
my_ggplot + # Adding confidence intervals to ggplot2 plot geom_errorbar(aes(ymin = lower_CI, ymax = upper_CI)) |
my_ggplot + # Adding confidence intervals to ggplot2 plot geom_errorbar(aes(ymin = lower_CI, ymax = upper_CI))

Further Resources & Related Articles
Please find some additional R tutorials on topics such as variables, graphics in R, and ggplot2 below.
