R How to Suppress Vertical & Horizontal Gridlines in ggplot2 Plot (2 Examples)
In this article you’ll learn how to suppress ggplot2 gridlines in R.
Setting up the Examples
data(iris) # Load iris data head(iris) # Inspect iris data # Sepal.Length Sepal.Width Petal.Length Petal.Width Species # 1 5.1 3.5 1.4 0.2 setosa # 2 4.9 3.0 1.4 0.2 setosa # 3 4.7 3.2 1.3 0.2 setosa # 4 4.6 3.1 1.5 0.2 setosa # 5 5.0 3.6 1.4 0.2 setosa # 6 5.4 3.9 1.7 0.4 setosa |
data(iris) # Load iris data head(iris) # Inspect iris data # Sepal.Length Sepal.Width Petal.Length Petal.Width Species # 1 5.1 3.5 1.4 0.2 setosa # 2 4.9 3.0 1.4 0.2 setosa # 3 4.7 3.2 1.3 0.2 setosa # 4 4.6 3.1 1.5 0.2 setosa # 5 5.0 3.6 1.4 0.2 setosa # 6 5.4 3.9 1.7 0.4 setosa
install.packages("ggplot2") # Install & load ggplot2 library("ggplot2") |
install.packages("ggplot2") # Install & load ggplot2 library("ggplot2")
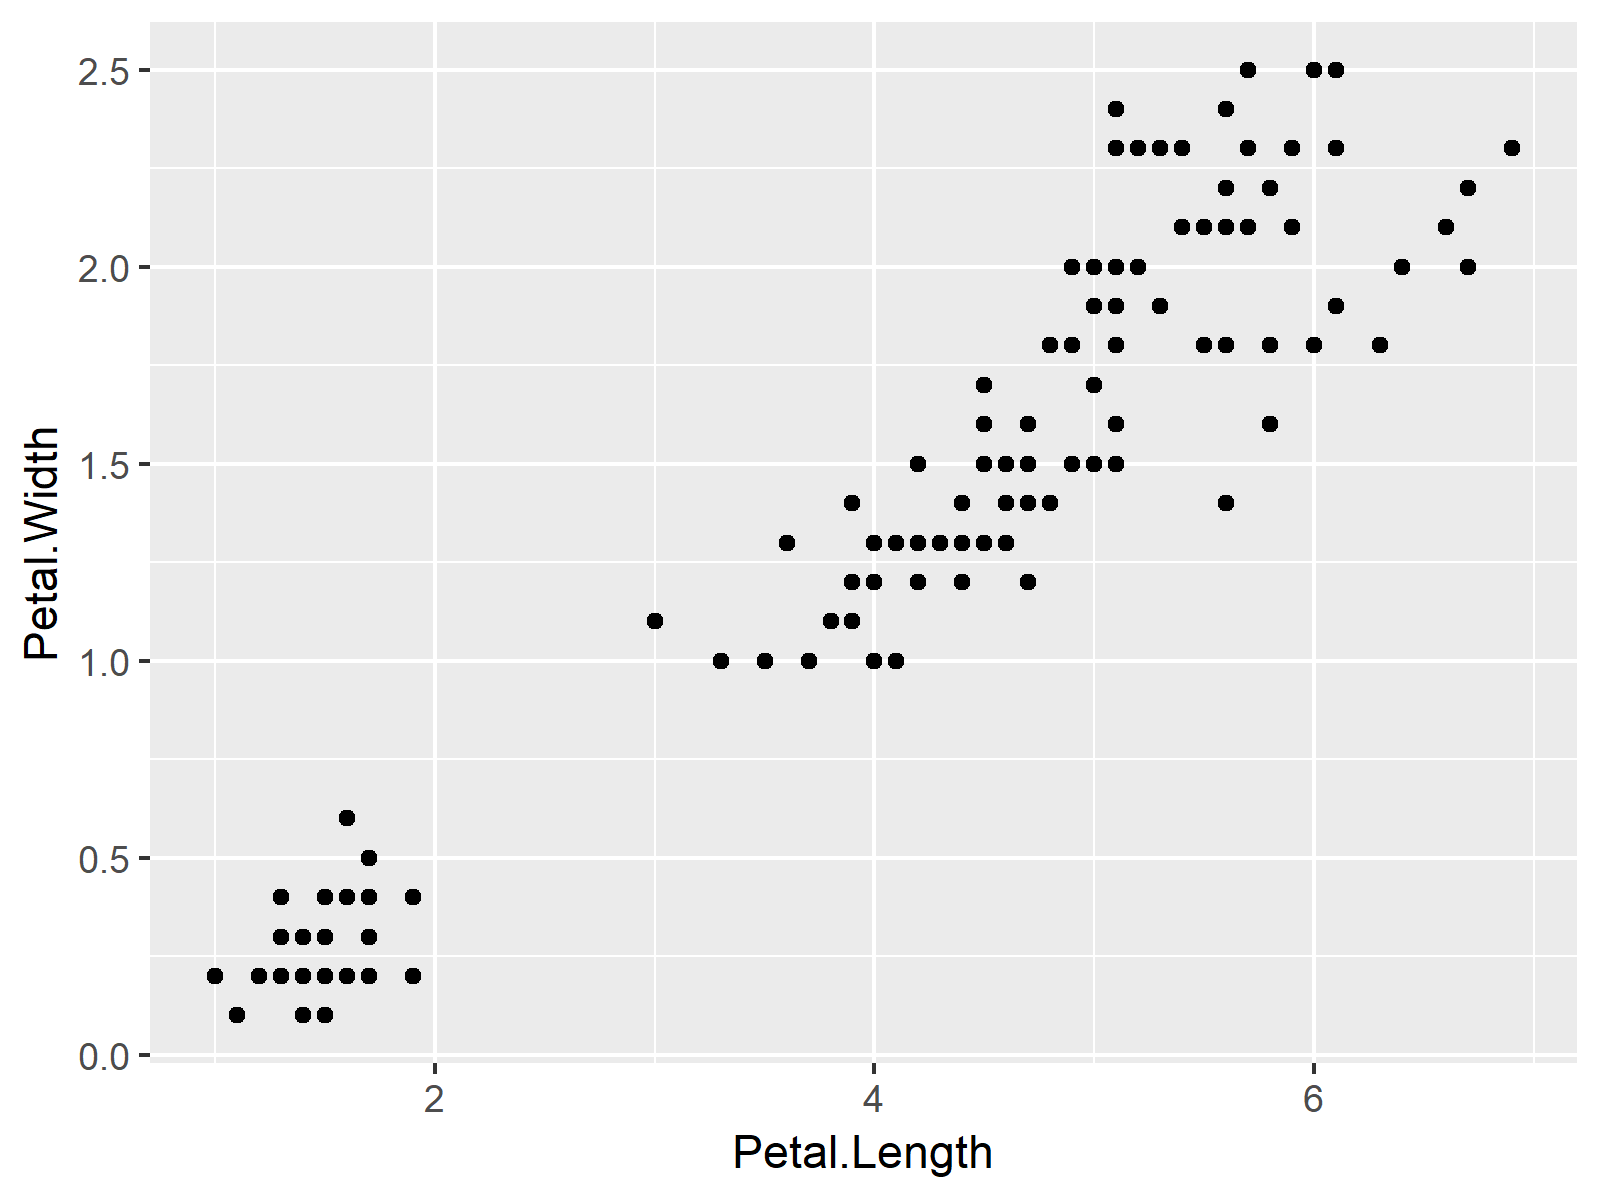
my_plot <- ggplot(iris, # Draw ggplot2 graph with grid aes(x = Petal.Length, y = Petal.Width)) + geom_point() my_plot # Printing graph |
my_plot <- ggplot(iris, # Draw ggplot2 graph with grid aes(x = Petal.Length, y = Petal.Width)) + geom_point() my_plot # Printing graph

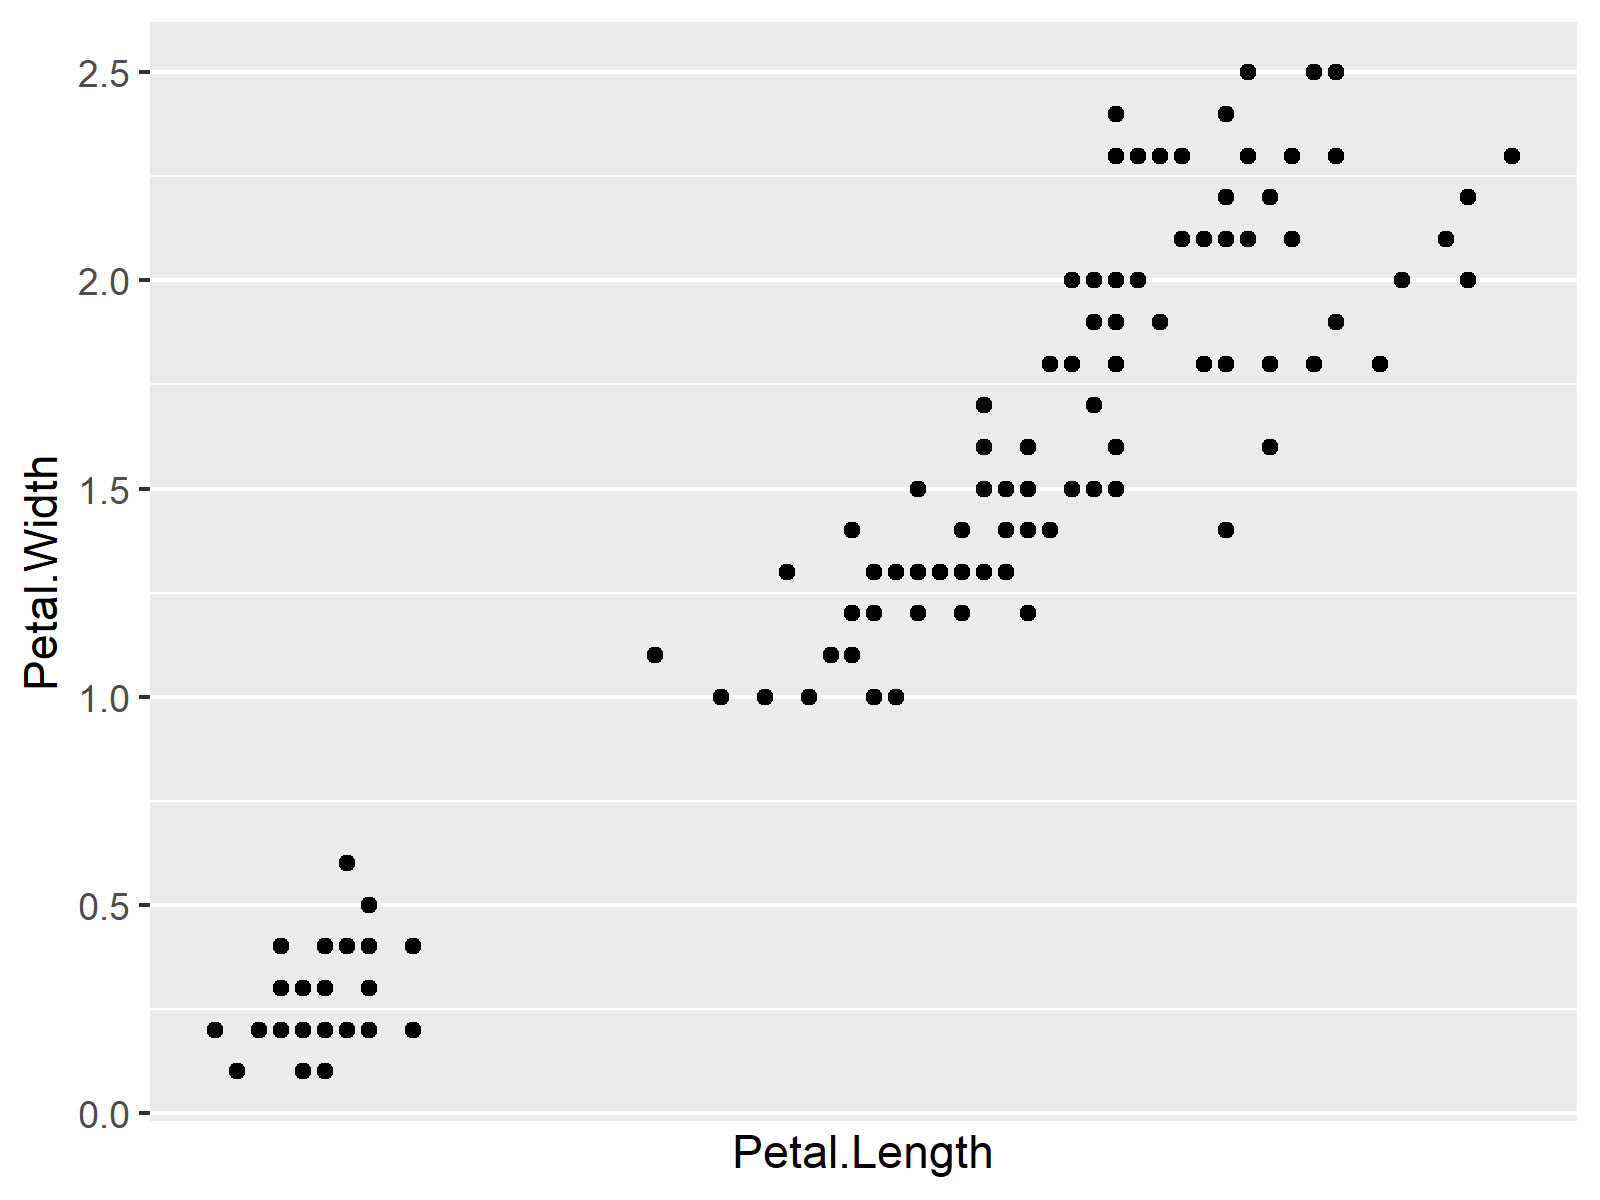
Example 1: Remove Vertical Lines from ggplot2 Plot
my_plot + # ggplot2 graph without vertical gridlines scale_x_continuous(breaks = NULL) |
my_plot + # ggplot2 graph without vertical gridlines scale_x_continuous(breaks = NULL)

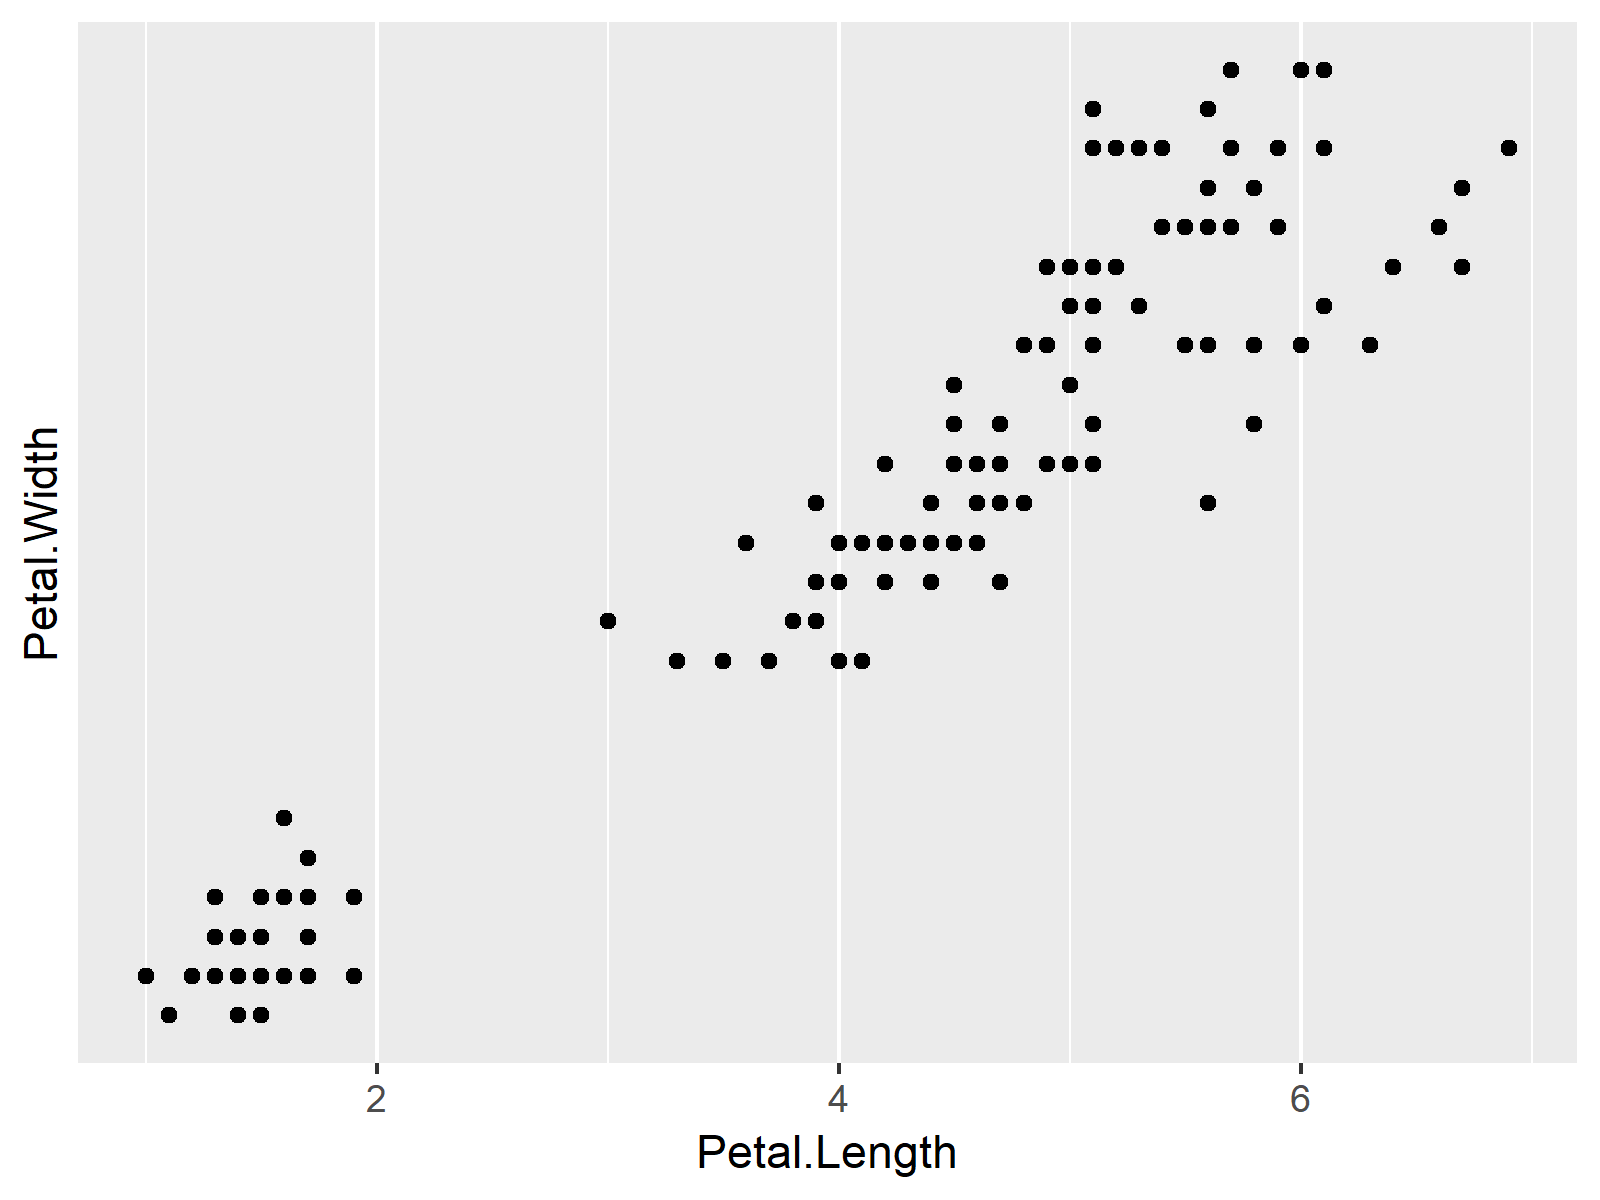
Example 2: Remove Horizontal Lines from ggplot2 Plot
my_plot + # ggplot2 graph without horizontal gridlines scale_y_continuous(breaks = NULL) |
my_plot + # ggplot2 graph without horizontal gridlines scale_y_continuous(breaks = NULL)

