R How to Display a ggplot2 Plot when Running a Script (Example Code)
In this article, I’ll explain how to display ggplot2 plots within a running script in the R programming language.
Setting up the Example
data(iris) # Loading iris head(iris) # Sepal.Length Sepal.Width Petal.Length Petal.Width Species # 1 5.1 3.5 1.4 0.2 setosa # 2 4.9 3.0 1.4 0.2 setosa # 3 4.7 3.2 1.3 0.2 setosa # 4 4.6 3.1 1.5 0.2 setosa # 5 5.0 3.6 1.4 0.2 setosa # 6 5.4 3.9 1.7 0.4 setosa |
data(iris) # Loading iris head(iris) # Sepal.Length Sepal.Width Petal.Length Petal.Width Species # 1 5.1 3.5 1.4 0.2 setosa # 2 4.9 3.0 1.4 0.2 setosa # 3 4.7 3.2 1.3 0.2 setosa # 4 4.6 3.1 1.5 0.2 setosa # 5 5.0 3.6 1.4 0.2 setosa # 6 5.4 3.9 1.7 0.4 setosa
install.packages("ggplot2") # Install & load ggplot2 library("ggplot2") |
install.packages("ggplot2") # Install & load ggplot2 library("ggplot2")
for(i in 1:10) { # Running for-loop in R if(i == 5) { my_plot <- ggplot(iris, aes(x = Petal.Length, y = Petal.Width)) + geom_point() my_plot } } |
for(i in 1:10) { # Running for-loop in R if(i == 5) { my_plot <- ggplot(iris, aes(x = Petal.Length, y = Petal.Width)) + geom_point() my_plot } }
After running the previous R syntax, no plot is shown.
Example: Return ggplot2 Graph within for-Loop with print() Function
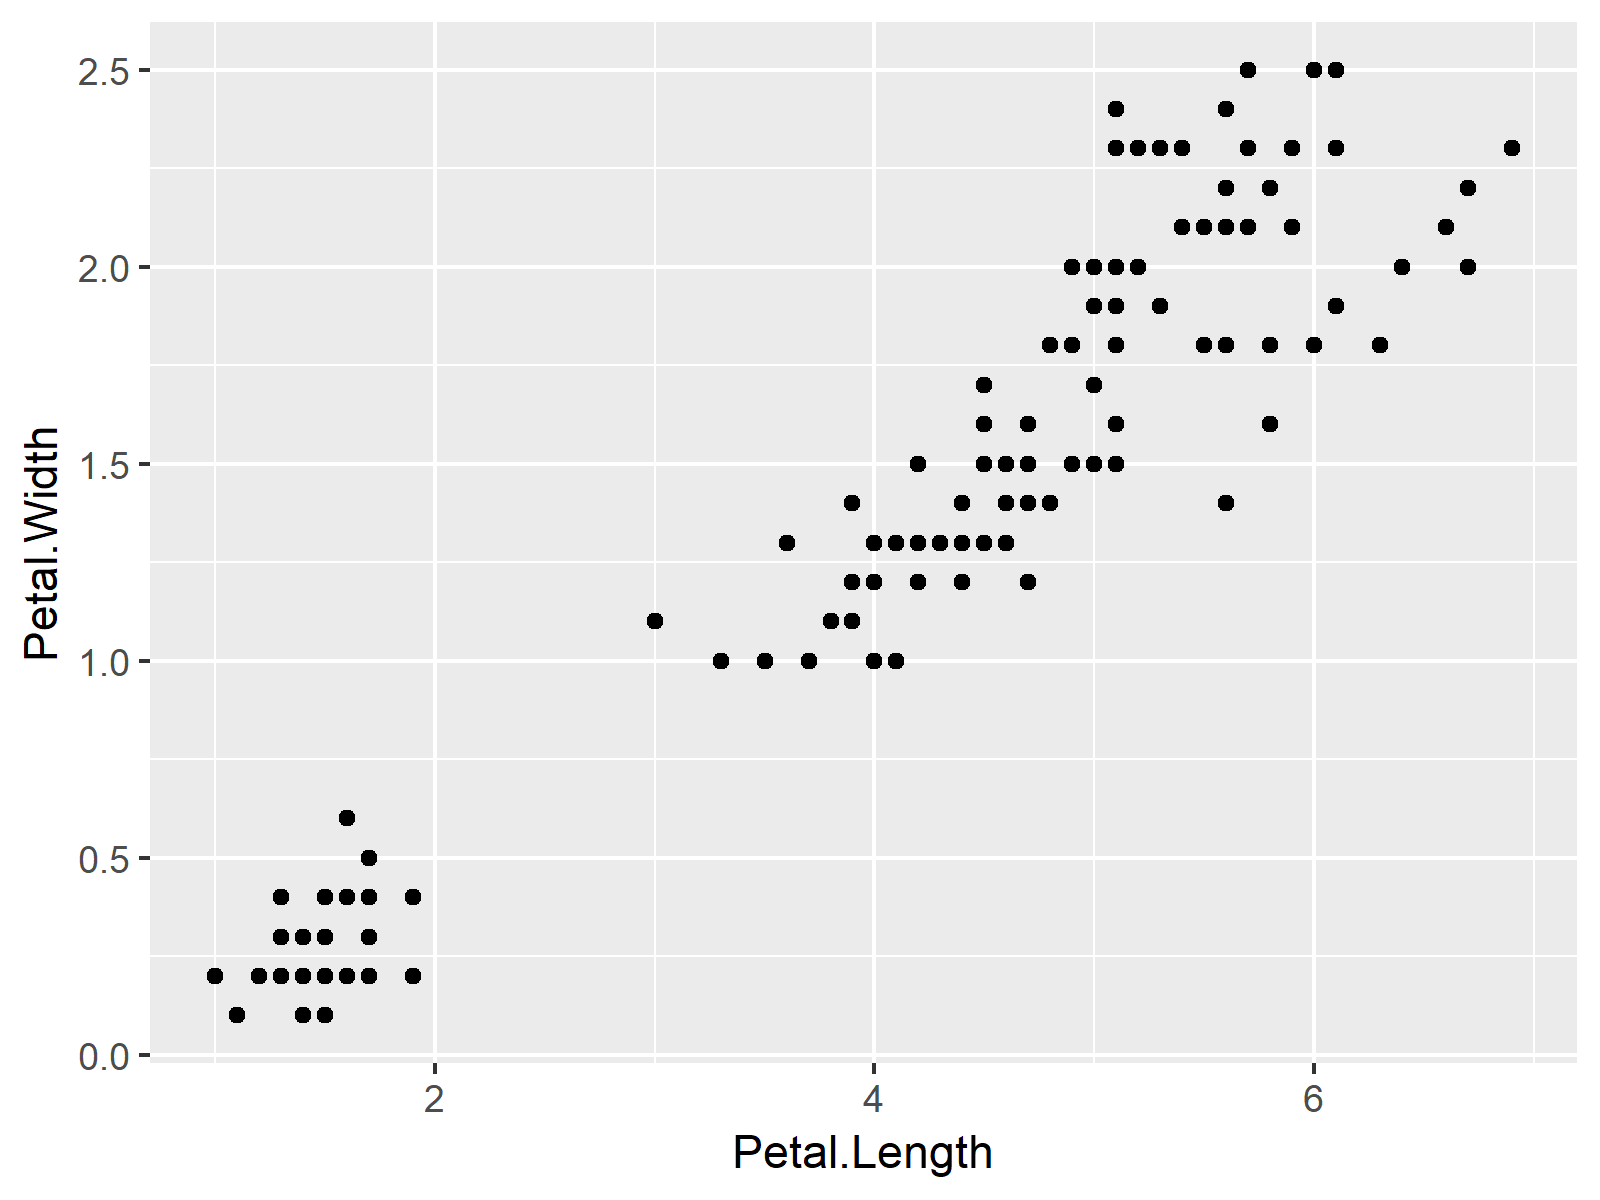
We can show plots created within a for-loop using the print function in R:
for(i in 1:10) { # Run for-loop again if(i == 5) { my_plot <- ggplot(iris, aes(x = Petal.Length, y = Petal.Width)) + geom_point() print(my_plot) # Explicitly draw ggplot2 plot } } |
for(i in 1:10) { # Run for-loop again if(i == 5) { my_plot <- ggplot(iris, aes(x = Petal.Length, y = Petal.Width)) + geom_point() print(my_plot) # Explicitly draw ggplot2 plot } }

