Change Axis Ticks of ggplot2 Graph in R (Example Code)
This article illustrates how to change the axis tick marks of a ggplot2 graphic in R programming.
Setting up the Example
data(iris) # Loading iris data head(iris) # Sepal.Length Sepal.Width Petal.Length Petal.Width Species # 1 5.1 3.5 1.4 0.2 setosa # 2 4.9 3.0 1.4 0.2 setosa # 3 4.7 3.2 1.3 0.2 setosa # 4 4.6 3.1 1.5 0.2 setosa # 5 5.0 3.6 1.4 0.2 setosa # 6 5.4 3.9 1.7 0.4 setosa |
data(iris) # Loading iris data head(iris) # Sepal.Length Sepal.Width Petal.Length Petal.Width Species # 1 5.1 3.5 1.4 0.2 setosa # 2 4.9 3.0 1.4 0.2 setosa # 3 4.7 3.2 1.3 0.2 setosa # 4 4.6 3.1 1.5 0.2 setosa # 5 5.0 3.6 1.4 0.2 setosa # 6 5.4 3.9 1.7 0.4 setosa
install.packages("ggplot2") # Install ggplot2 package library("ggplot2") # Load ggplot2 |
install.packages("ggplot2") # Install ggplot2 package library("ggplot2") # Load ggplot2
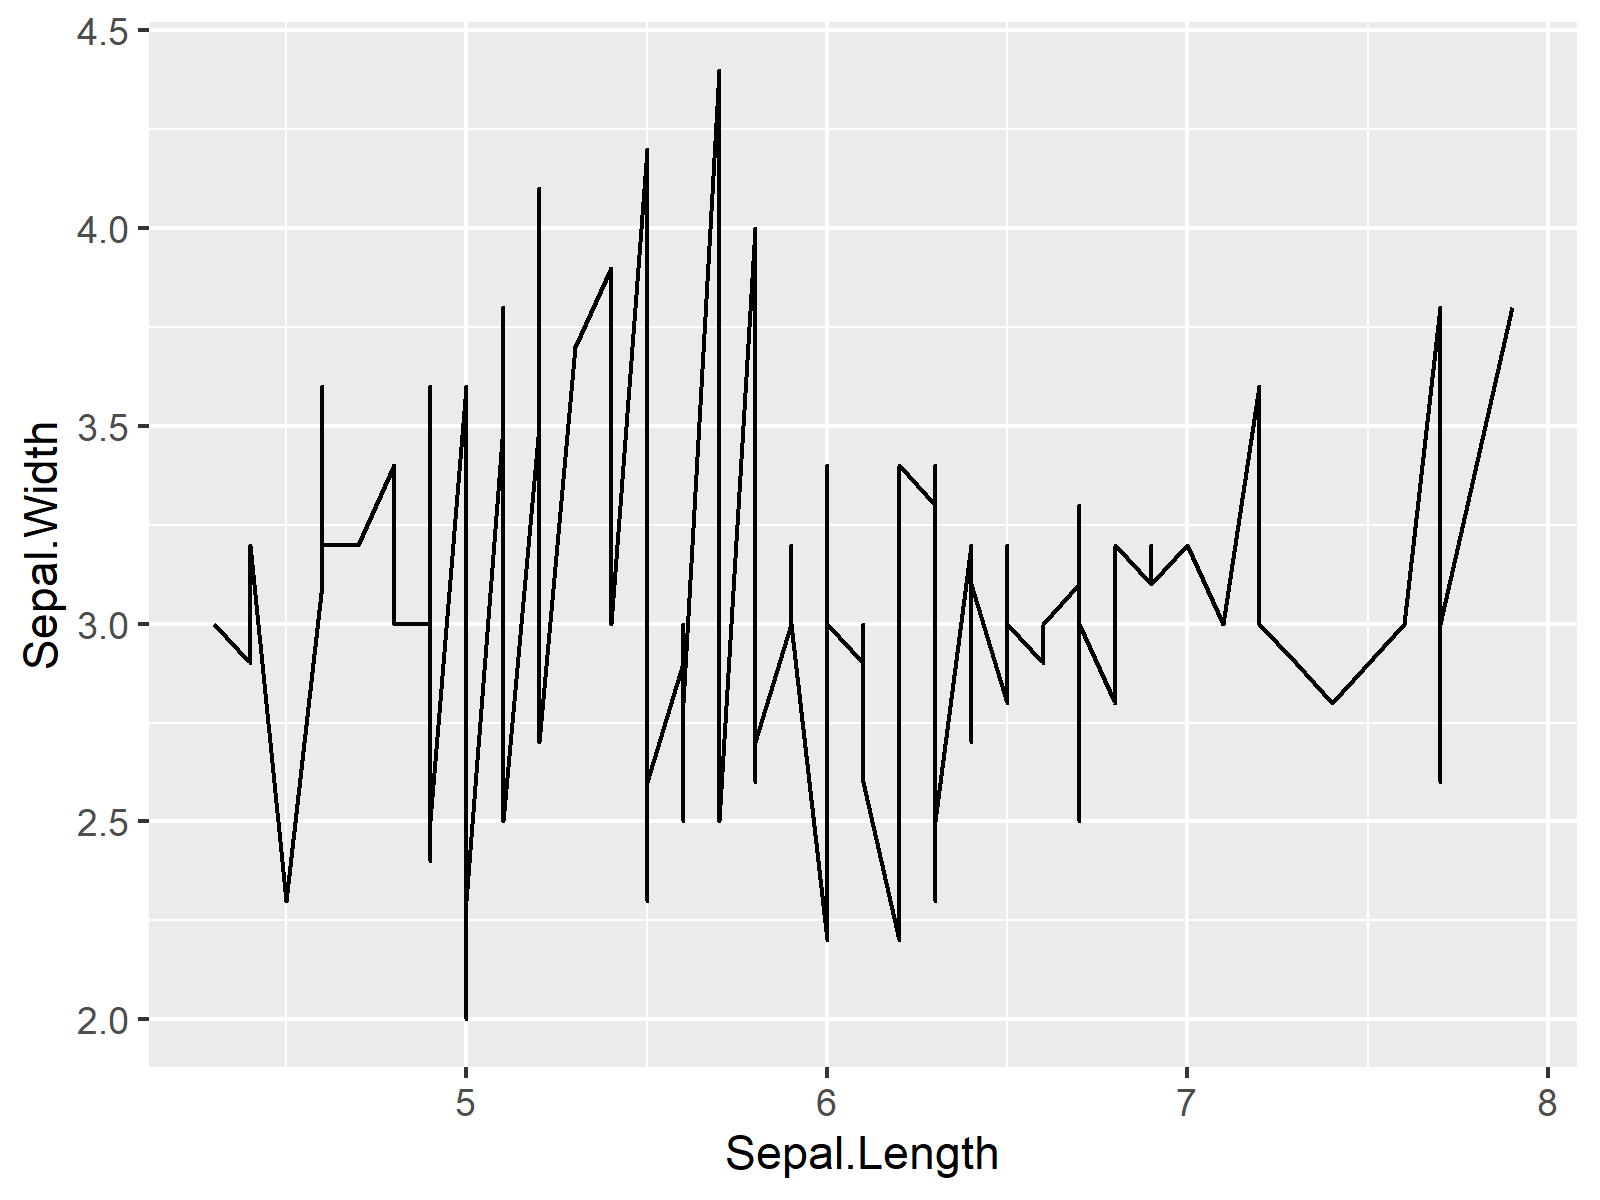
my_plot <- ggplot(iris, # ggplot2 graph with default axis breaks aes(x = Sepal.Length, y = Sepal.Width)) + geom_line() my_plot |
my_plot <- ggplot(iris, # ggplot2 graph with default axis breaks aes(x = Sepal.Length, y = Sepal.Width)) + geom_line() my_plot

Example: Set X-Axis Ticks in ggplot2 Plot Manually Using scale_x_continuous() Function
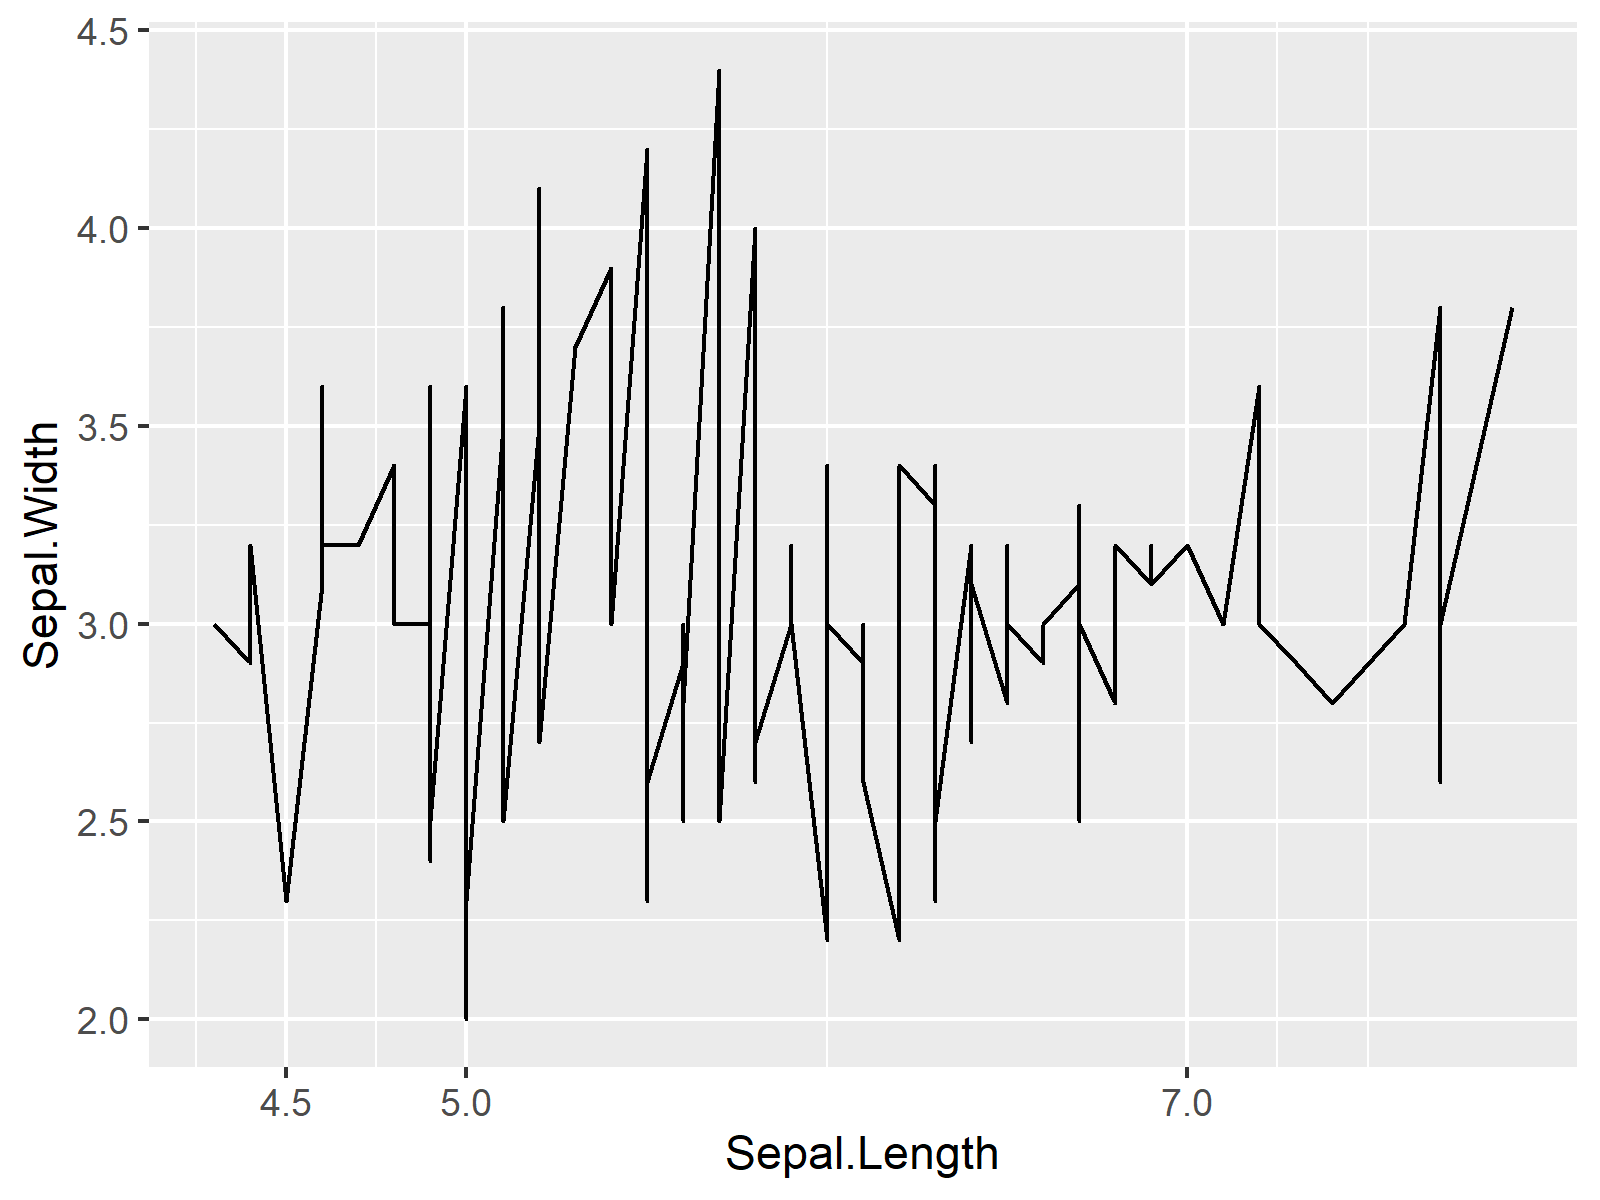
my_plot + # Setting axis ticks manually scale_x_continuous(breaks = c(4.5, 5, 7)) |
my_plot + # Setting axis ticks manually scale_x_continuous(breaks = c(4.5, 5, 7))

Related Articles
In addition, you might want to have a look at the related tutorials of my website:
