Draw User-Defined Axis Ticks Using axis() Function in R (Example Code)
In this article, I’ll illustrate how to apply the axis function in the R programming language.
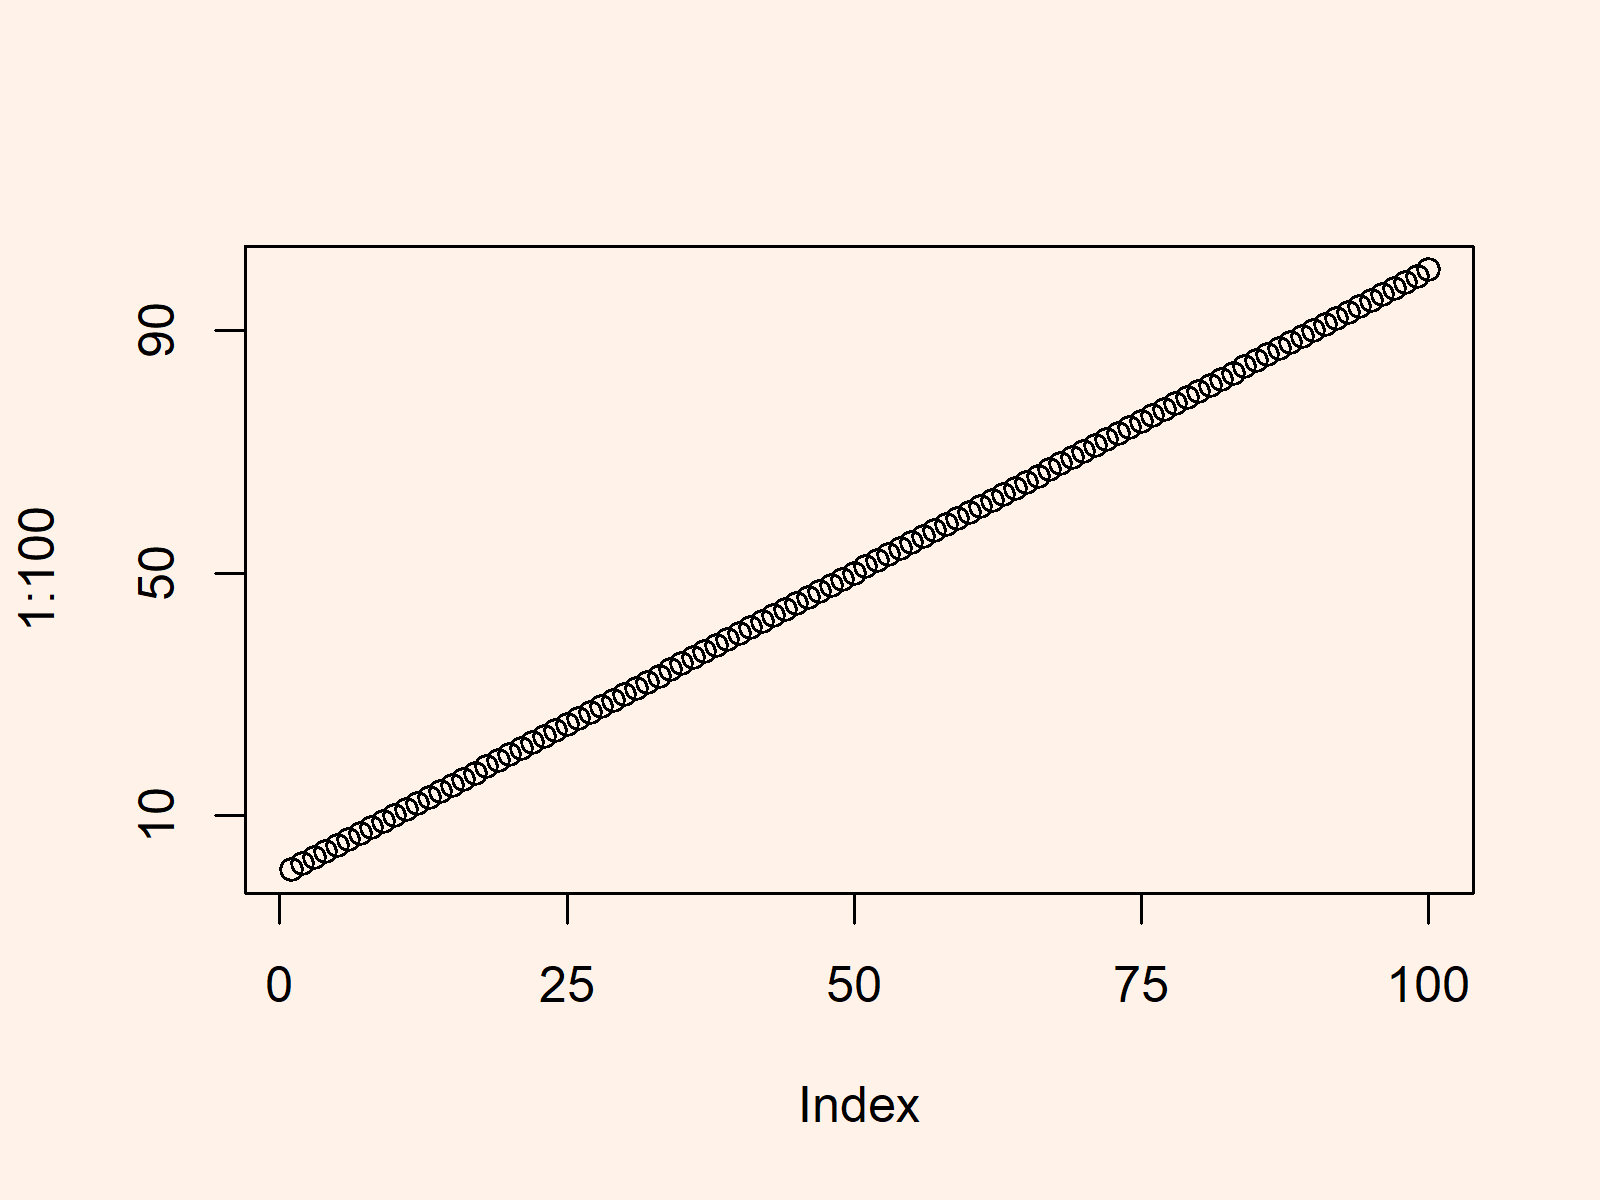
Example: Creating Plot with User-Defined Axis Ticks Using axis() Function
plot(1:100, xaxt = "n", yaxt = "n") # Drawing graph without axes axis(side = 1, c(0, 25, 50, 75, 100)) # Adding x-axis ticks axis(side = 2, c(10, 50, 90)) # Adding y-axis ticks |
plot(1:100, xaxt = "n", yaxt = "n") # Drawing graph without axes axis(side = 1, c(0, 25, 50, 75, 100)) # Adding x-axis ticks axis(side = 2, c(10, 50, 90)) # Adding y-axis ticks

