Draw Barplot of Table Object in R (Example Code)
In this tutorial, I’ll demonstrate how to draw a plot based on a table in the R programming language.
Example Data
data(iris) # Importing data head(iris) # Sepal.Length Sepal.Width Petal.Length Petal.Width Species # 1 5.1 3.5 1.4 0.2 setosa # 2 4.9 3.0 1.4 0.2 setosa # 3 4.7 3.2 1.3 0.2 setosa # 4 4.6 3.1 1.5 0.2 setosa # 5 5.0 3.6 1.4 0.2 setosa # 6 5.4 3.9 1.7 0.4 setosa |
data(iris) # Importing data head(iris) # Sepal.Length Sepal.Width Petal.Length Petal.Width Species # 1 5.1 3.5 1.4 0.2 setosa # 2 4.9 3.0 1.4 0.2 setosa # 3 4.7 3.2 1.3 0.2 setosa # 4 4.6 3.1 1.5 0.2 setosa # 5 5.0 3.6 1.4 0.2 setosa # 6 5.4 3.9 1.7 0.4 setosa
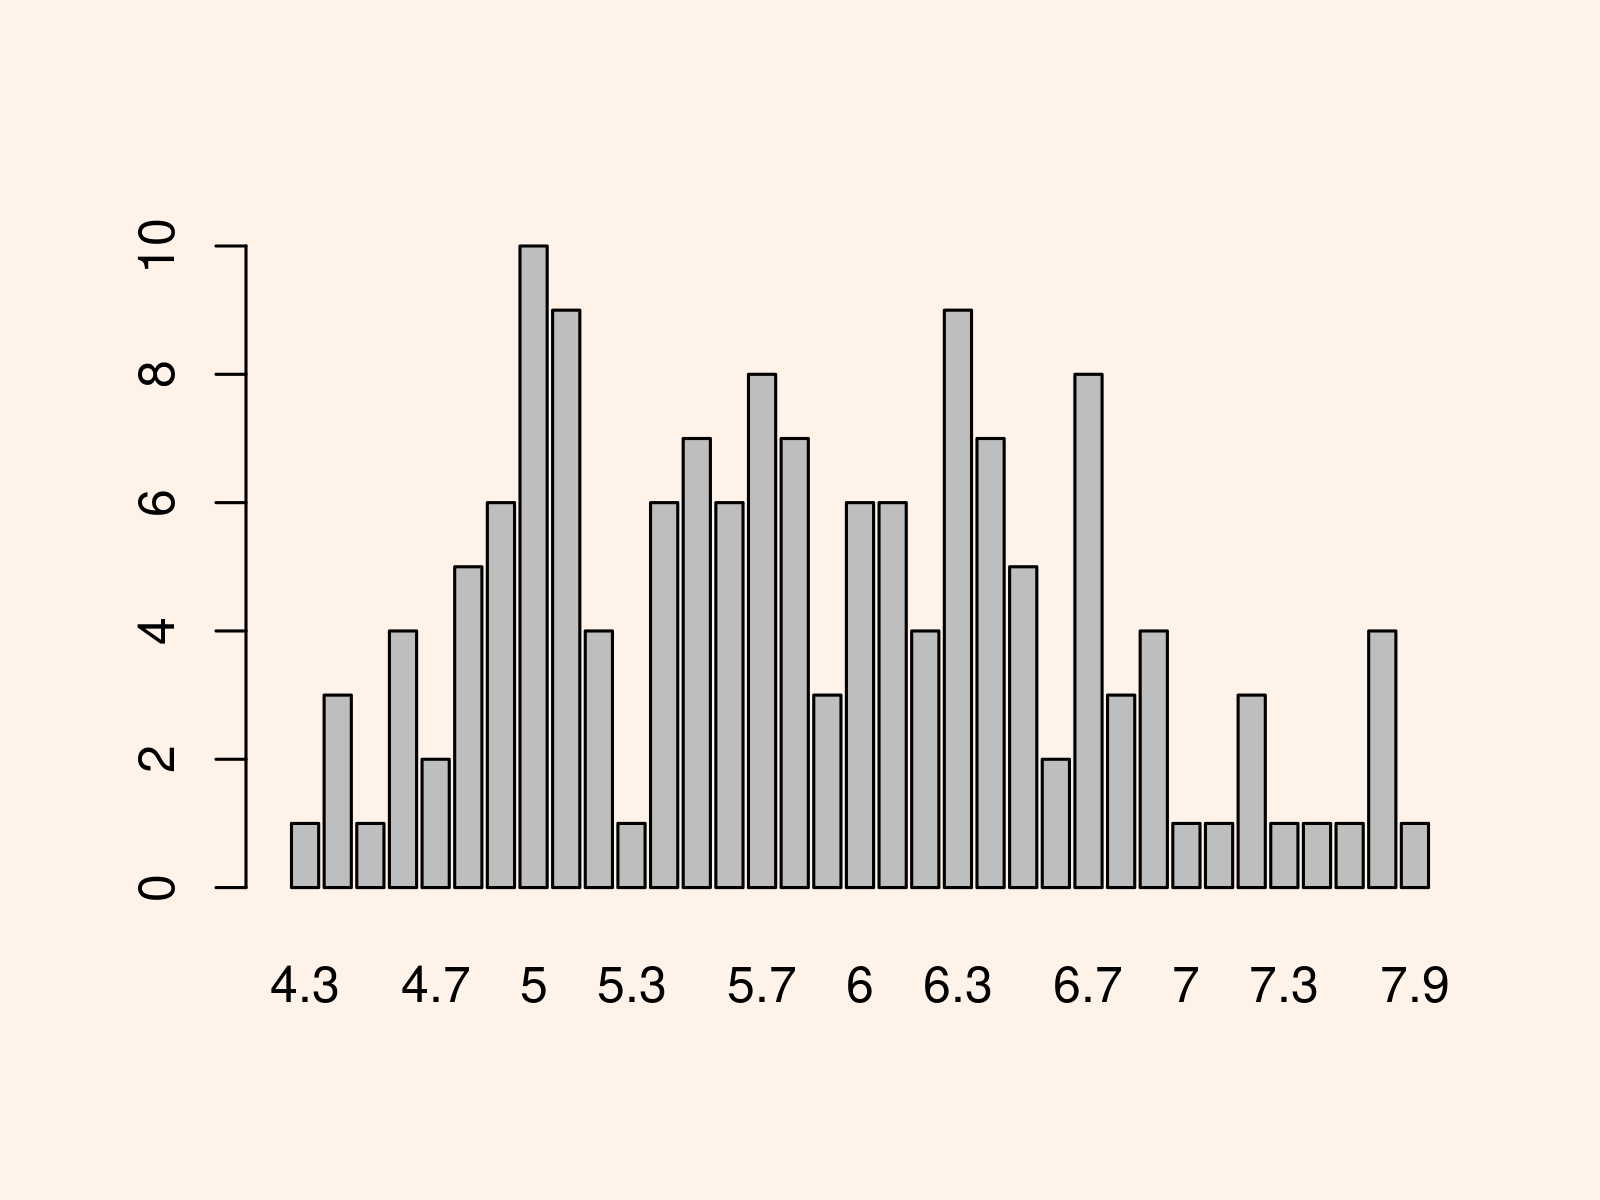
Example: Draw Barplot of Table Using barplot() & table() Functions
barplot(table(iris$Sepal.Length)) # Plotting table in barplot |
barplot(table(iris$Sepal.Length)) # Plotting table in barplot

Related Tutorials & Further Resources
Have a look at the following R tutorials. They focus on topics such as plot legends, variables, lines, and graphics in R.
