R Annotate Different Text to Each Facet in ggplot2 (Example Code)
This article illustrates how to annotate different text elements to each facet of a ggplot2 facet graph in the R programming language.
Setting up the Example
data(iris) # Loading iris data head(iris) # Sepal.Length Sepal.Width Petal.Length Petal.Width Species # 1 5.1 3.5 1.4 0.2 setosa # 2 4.9 3.0 1.4 0.2 setosa # 3 4.7 3.2 1.3 0.2 setosa # 4 4.6 3.1 1.5 0.2 setosa # 5 5.0 3.6 1.4 0.2 setosa # 6 5.4 3.9 1.7 0.4 setosa |
data(iris) # Loading iris data head(iris) # Sepal.Length Sepal.Width Petal.Length Petal.Width Species # 1 5.1 3.5 1.4 0.2 setosa # 2 4.9 3.0 1.4 0.2 setosa # 3 4.7 3.2 1.3 0.2 setosa # 4 4.6 3.1 1.5 0.2 setosa # 5 5.0 3.6 1.4 0.2 setosa # 6 5.4 3.9 1.7 0.4 setosa
install.packages("ggplot2") # Install ggplot2 package library("ggplot2") # Load ggplot2 |
install.packages("ggplot2") # Install ggplot2 package library("ggplot2") # Load ggplot2
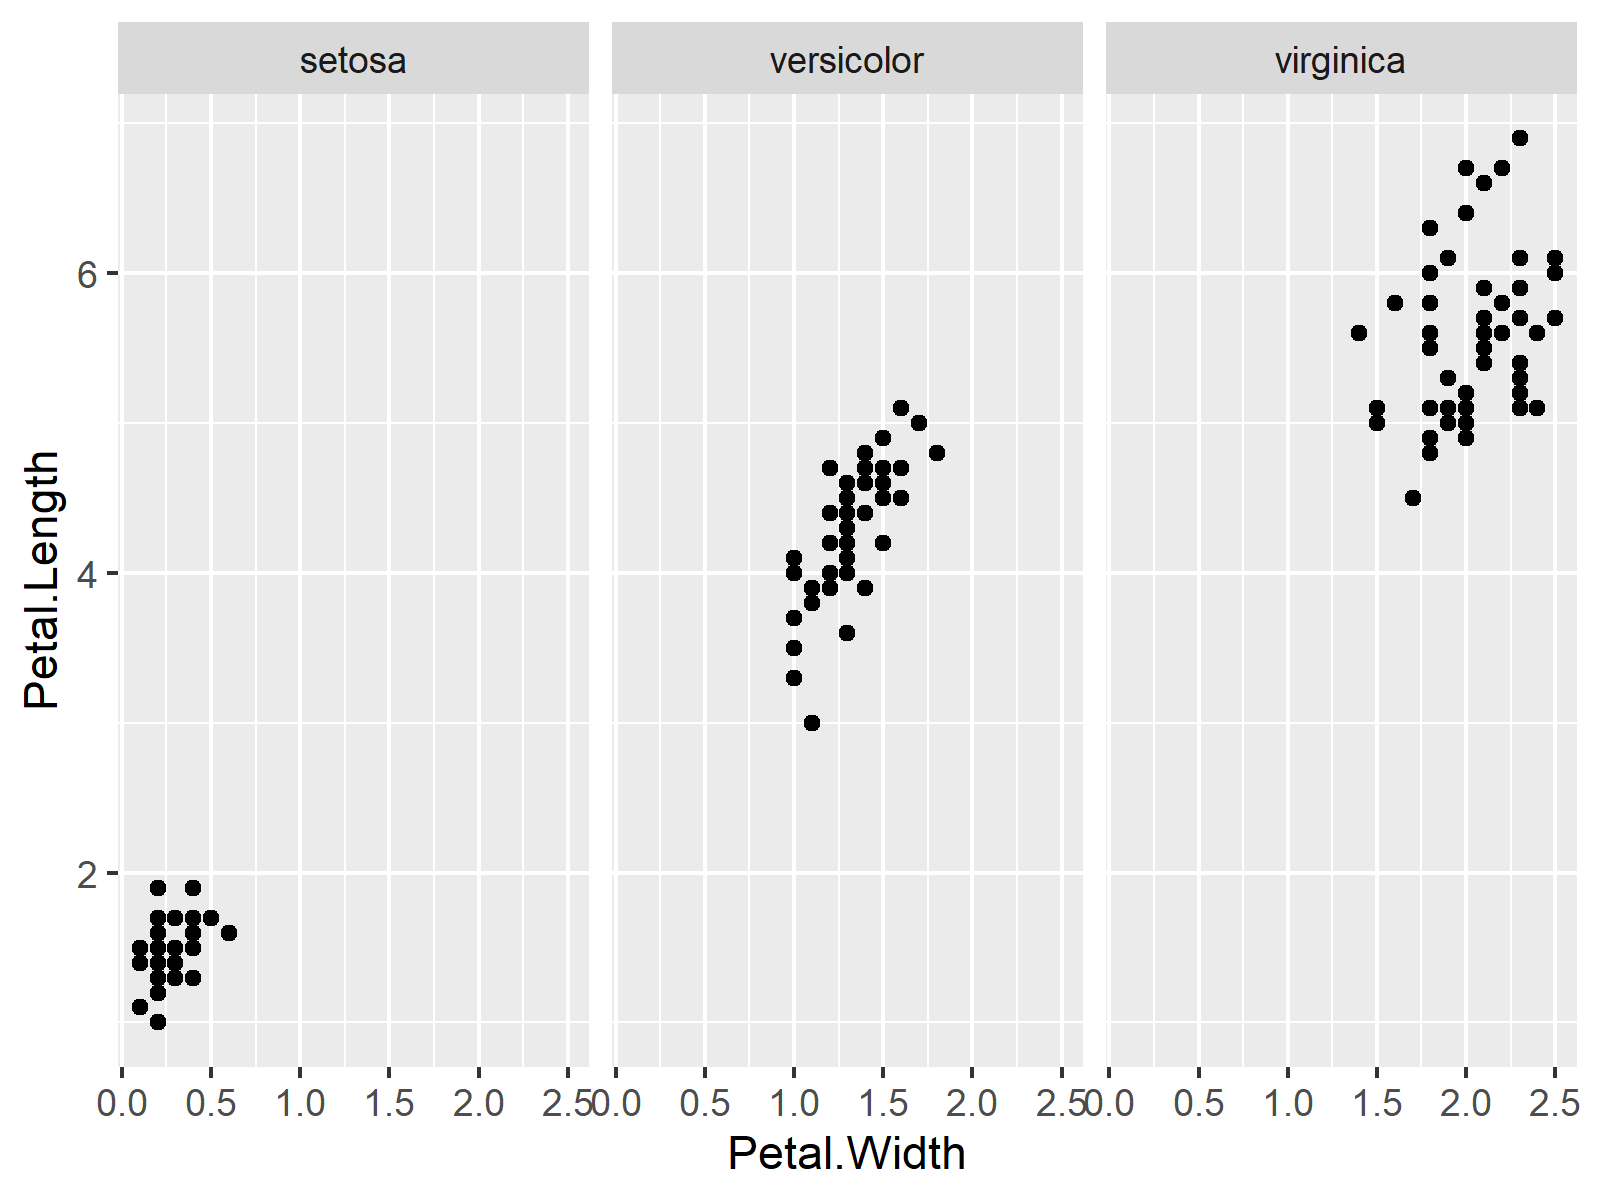
my_plot <- ggplot(iris, # Default facet plot without text aes(x = Petal.Width, y = Petal.Length, group = Species)) + geom_point() + facet_grid(. ~ Species) my_plot |
my_plot <- ggplot(iris, # Default facet plot without text aes(x = Petal.Width, y = Petal.Length, group = Species)) + geom_point() + facet_grid(. ~ Species) my_plot

Example: Adding Different Text Element to Each ggplot2 Facet
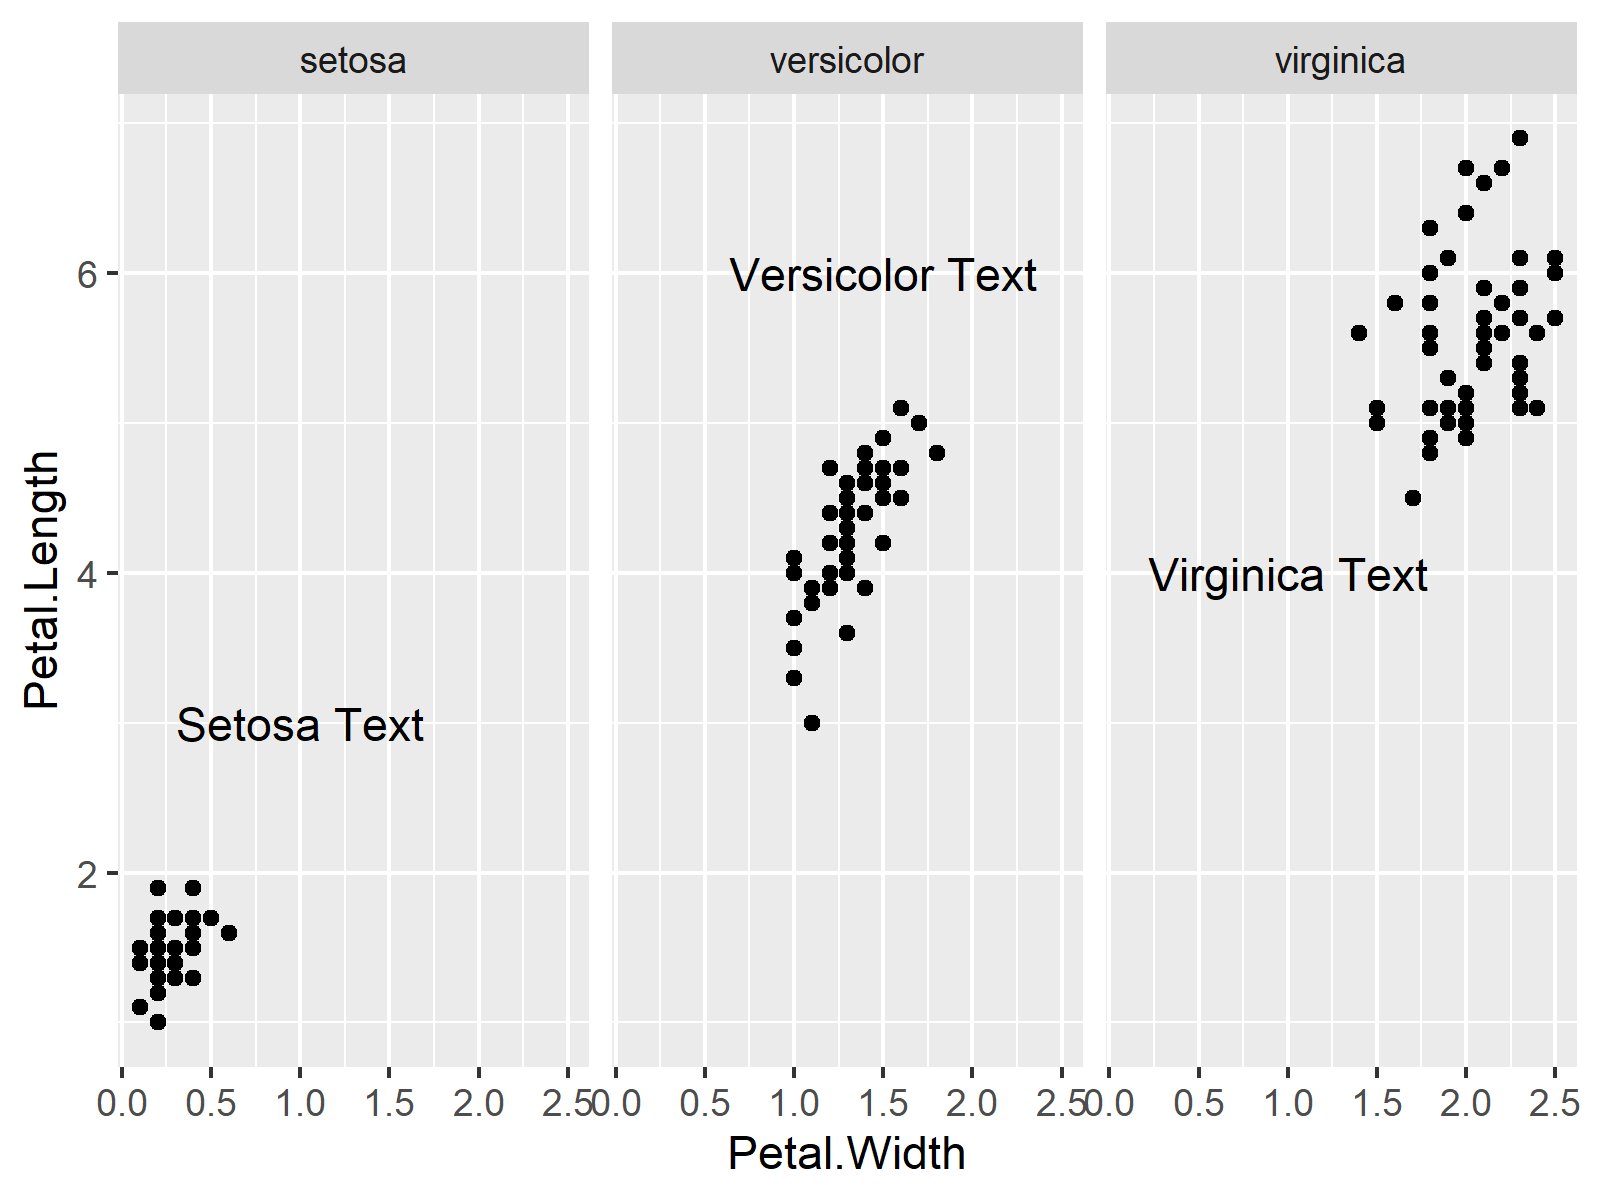
iris_text <- data.frame(label = c("Setosa Text", # Data frame with text info "Versicolor Text", "Virginica Text"), Species = names(table(iris$Species)), x = c(1, 1.5, 1), y = c(3, 6, 4)) iris_text |
iris_text <- data.frame(label = c("Setosa Text", # Data frame with text info "Versicolor Text", "Virginica Text"), Species = names(table(iris$Species)), x = c(1, 1.5, 1), y = c(3, 6, 4)) iris_text
my_plot + # Drawing different text to each facet geom_text(data = iris_text, mapping = aes(x = x, y = y, label = label)) |
my_plot + # Drawing different text to each facet geom_text(data = iris_text, mapping = aes(x = x, y = y, label = label))

Related Articles & Further Resources
In the following, you can find some additional resources on topics such as ggplot2, labels, graphics in R, and text elements:
