Draw Plot Legend with White Border & Background in R (Example Code)
In this R programming tutorial you’ll learn how to draw a white legend.
Example Data
data(iris) # Loading some example data head(iris) # Sepal.Length Sepal.Width Petal.Length Petal.Width Species # 1 5.1 3.5 1.4 0.2 setosa # 2 4.9 3.0 1.4 0.2 setosa # 3 4.7 3.2 1.3 0.2 setosa # 4 4.6 3.1 1.5 0.2 setosa # 5 5.0 3.6 1.4 0.2 setosa # 6 5.4 3.9 1.7 0.4 setosa |
data(iris) # Loading some example data head(iris) # Sepal.Length Sepal.Width Petal.Length Petal.Width Species # 1 5.1 3.5 1.4 0.2 setosa # 2 4.9 3.0 1.4 0.2 setosa # 3 4.7 3.2 1.3 0.2 setosa # 4 4.6 3.1 1.5 0.2 setosa # 5 5.0 3.6 1.4 0.2 setosa # 6 5.4 3.9 1.7 0.4 setosa
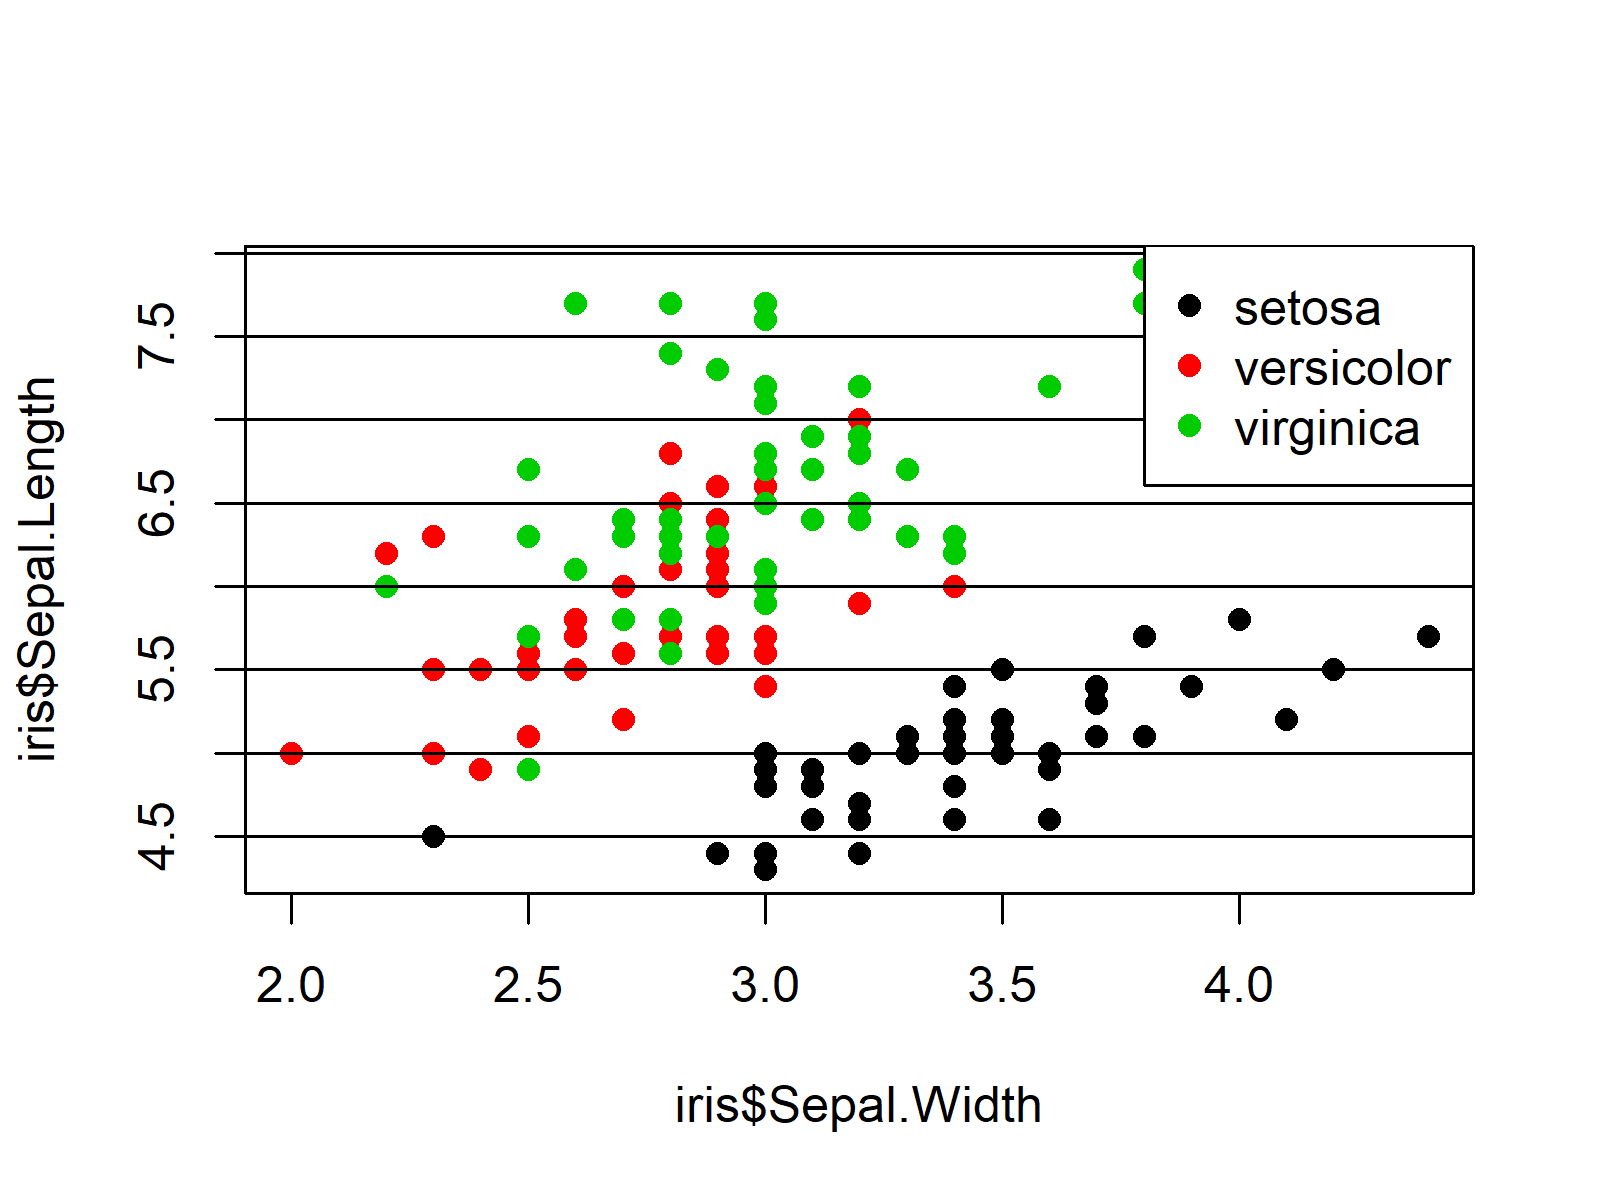
plot(x = iris$Sepal.Width, # Base R plot y = iris$Sepal.Length, col = iris$Species, pch = 16) abline(h = seq(1, 10, 0.5)) # Draw horizontal lines legend("topright", # Add legend legend = levels(iris$Species), col = 1:3, pch = 16) |
plot(x = iris$Sepal.Width, # Base R plot y = iris$Sepal.Length, col = iris$Species, pch = 16) abline(h = seq(1, 10, 0.5)) # Draw horizontal lines legend("topright", # Add legend legend = levels(iris$Species), col = 1:3, pch = 16)

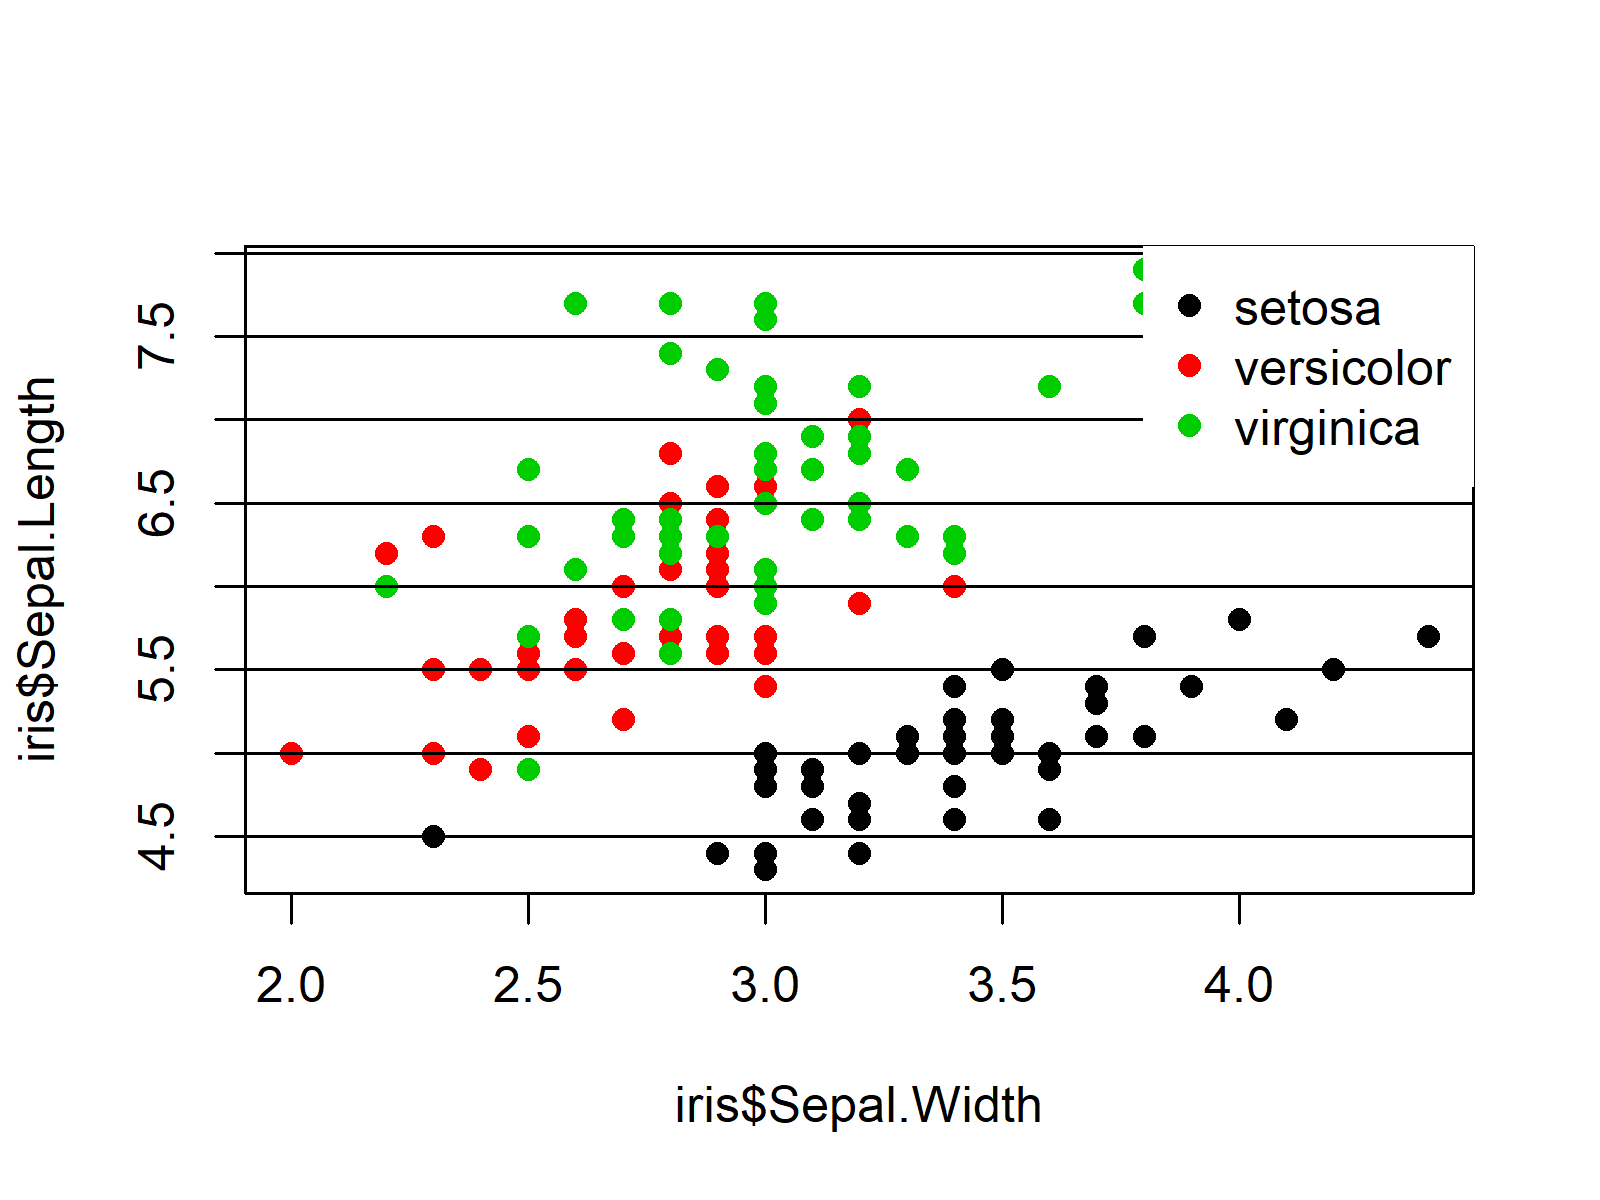
Example: Drawing Legend with White Borders & Background
plot(x = iris$Sepal.Width, # Base R plot y = iris$Sepal.Length, col = iris$Species, pch = 16) abline(h = seq(1, 10, 0.5)) # Draw horizontal lines legend("topright", # Add legend legend = levels(iris$Species), col = 1:3, pch = 16, box.col = "white") |
plot(x = iris$Sepal.Width, # Base R plot y = iris$Sepal.Length, col = iris$Species, pch = 16) abline(h = seq(1, 10, 0.5)) # Draw horizontal lines legend("topright", # Add legend legend = levels(iris$Species), col = 1:3, pch = 16, box.col = "white")

Related Tutorials & Further Resources
Please find some additional R tutorials on topics such as graphics in R, plot legends, and colors below.
