Use Different Continuous Color Ranges in ggplot2 Plot in R (Example Code)
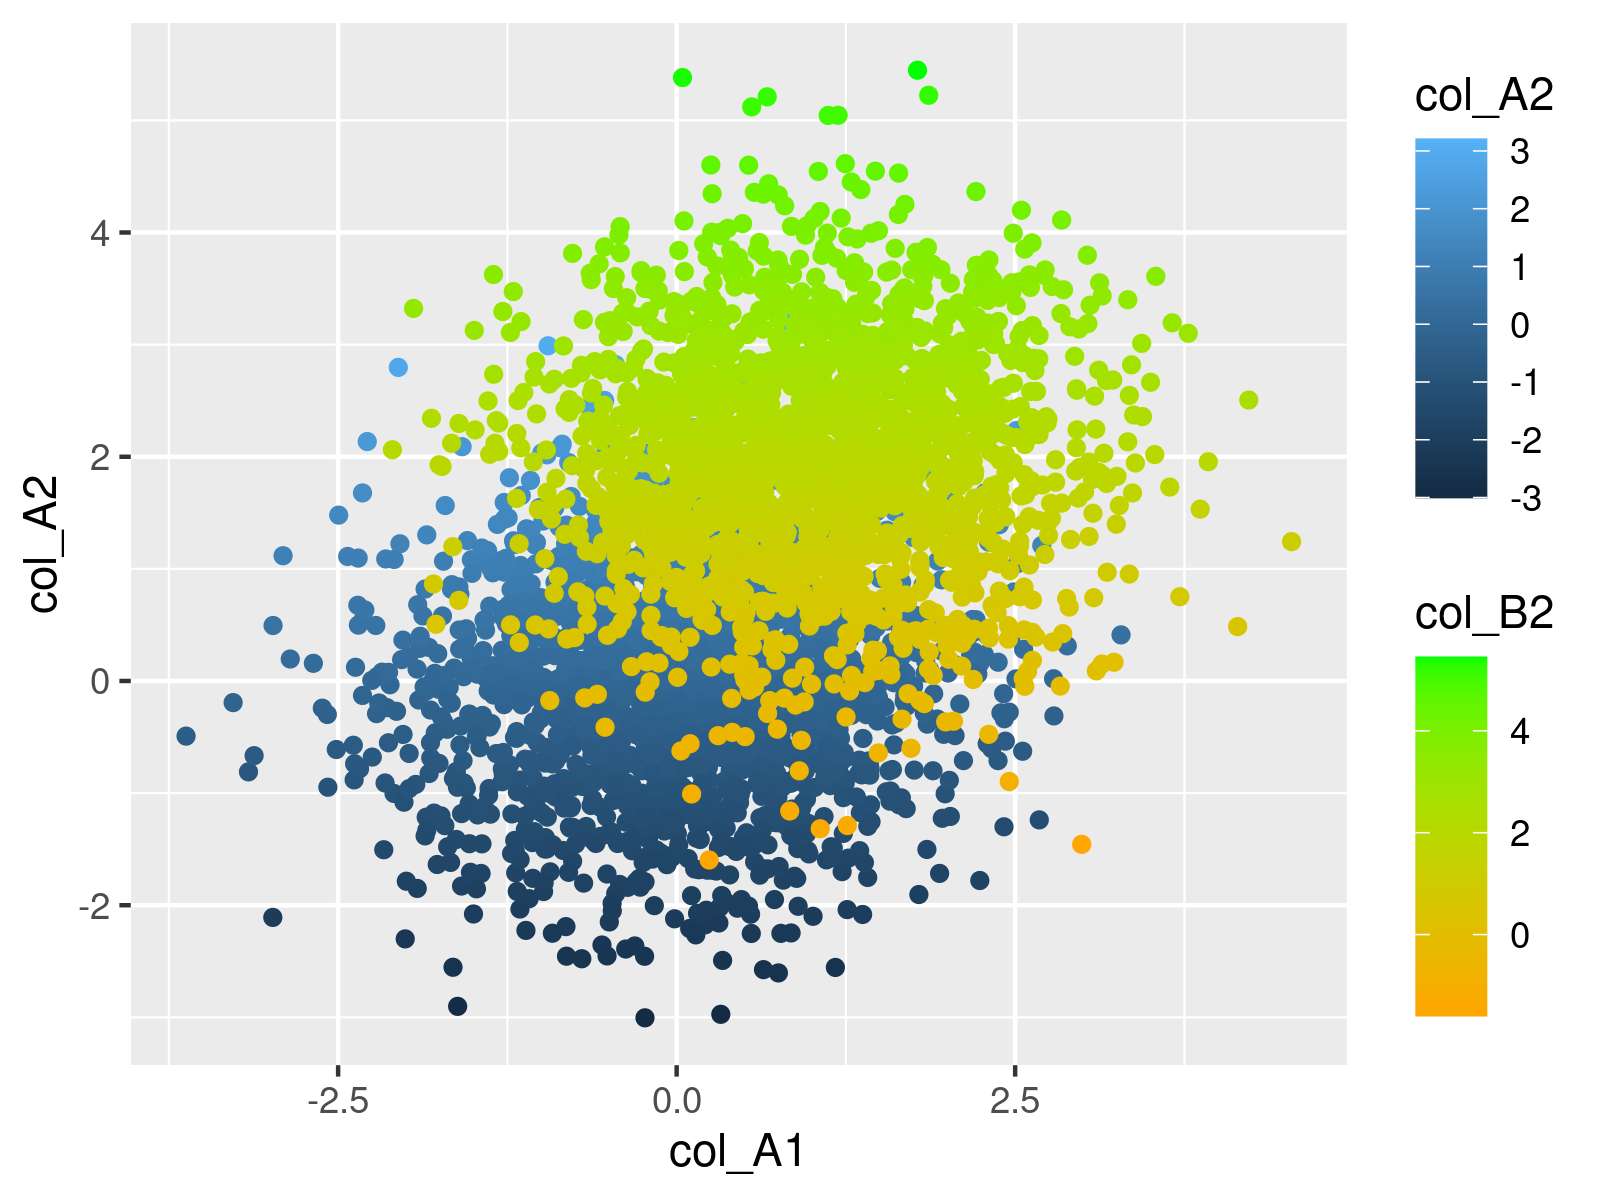
In this article you’ll learn how to use separate color scales in a continuous ggplot2 plot in the R programming language.
Introduction of Example Data
df_A <- data.frame(col_A1 = rnorm(2000), # Creating two example data frames col_A2 = rnorm(2000)) head(df_A) # col_A1 col_A2 # 1 1.8414805 -0.2720210 # 2 -1.9041667 -0.8073479 # 3 -0.4060661 -0.5361810 # 4 -0.6219814 1.0988337 # 5 0.5173054 1.1780451 # 6 0.5865414 -0.1596554 |
df_A <- data.frame(col_A1 = rnorm(2000), # Creating two example data frames col_A2 = rnorm(2000)) head(df_A) # col_A1 col_A2 # 1 1.8414805 -0.2720210 # 2 -1.9041667 -0.8073479 # 3 -0.4060661 -0.5361810 # 4 -0.6219814 1.0988337 # 5 0.5173054 1.1780451 # 6 0.5865414 -0.1596554
df_B <- data.frame(col_B1 = rnorm(2000, 1), col_B2 = rnorm(2000, 2)) head(df_B) # col_B1 col_B2 # 1 1.3797881 1.3423256 # 2 1.4964526 2.4750435 # 3 0.5011208 0.7928082 # 4 0.2265741 3.7817431 # 5 1.6988064 3.4189350 # 6 -0.3905503 0.8232247 |
df_B <- data.frame(col_B1 = rnorm(2000, 1), col_B2 = rnorm(2000, 2)) head(df_B) # col_B1 col_B2 # 1 1.3797881 1.3423256 # 2 1.4964526 2.4750435 # 3 0.5011208 0.7928082 # 4 0.2265741 3.7817431 # 5 1.6988064 3.4189350 # 6 -0.3905503 0.8232247
Example: Using Two Different Color Scales in Continuous ggplot2 Plot
install.packages("ggplot2") # Install & load ggplot2 package library("ggplot2") |
install.packages("ggplot2") # Install & load ggplot2 package library("ggplot2")
install.packages("ggnewscale") # Install & load ggnewscale library("ggnewscale") |
install.packages("ggnewscale") # Install & load ggnewscale library("ggnewscale")
ggplot() + # Drawin ggplot2 plot using two color ranges geom_point(data = df_A, aes(x = col_A1, y = col_A2, color = col_A2)) + new_scale_color() + geom_point(data = df_B, aes(x = col_B1, y = col_B2, color = col_B2)) + scale_color_gradient(low = "orange", high = "green") |
ggplot() + # Drawin ggplot2 plot using two color ranges geom_point(data = df_A, aes(x = col_A1, y = col_A2, color = col_A2)) + new_scale_color() + geom_point(data = df_B, aes(x = col_B1, y = col_B2, color = col_B2)) + scale_color_gradient(low = "orange", high = "green")

Related Tutorials
Below, you can find some additional resources that are related to the topic of this post.
