Set Range of ggplot2 scale_color_gradientn Manually in R (Example Code)
This article explains how to specify the color gradient range of a ggplot2 plot manually in R.
Preparing the Example
data(iris) # Loading data set head(iris) # Sepal.Length Sepal.Width Petal.Length Petal.Width Species # 1 5.1 3.5 1.4 0.2 setosa # 2 4.9 3.0 1.4 0.2 setosa # 3 4.7 3.2 1.3 0.2 setosa # 4 4.6 3.1 1.5 0.2 setosa # 5 5.0 3.6 1.4 0.2 setosa # 6 5.4 3.9 1.7 0.4 setosa |
data(iris) # Loading data set head(iris) # Sepal.Length Sepal.Width Petal.Length Petal.Width Species # 1 5.1 3.5 1.4 0.2 setosa # 2 4.9 3.0 1.4 0.2 setosa # 3 4.7 3.2 1.3 0.2 setosa # 4 4.6 3.1 1.5 0.2 setosa # 5 5.0 3.6 1.4 0.2 setosa # 6 5.4 3.9 1.7 0.4 setosa
install.packages("ggplot2") # Install ggplot2 package library("ggplot2") # Load ggplot2 package |
install.packages("ggplot2") # Install ggplot2 package library("ggplot2") # Load ggplot2 package
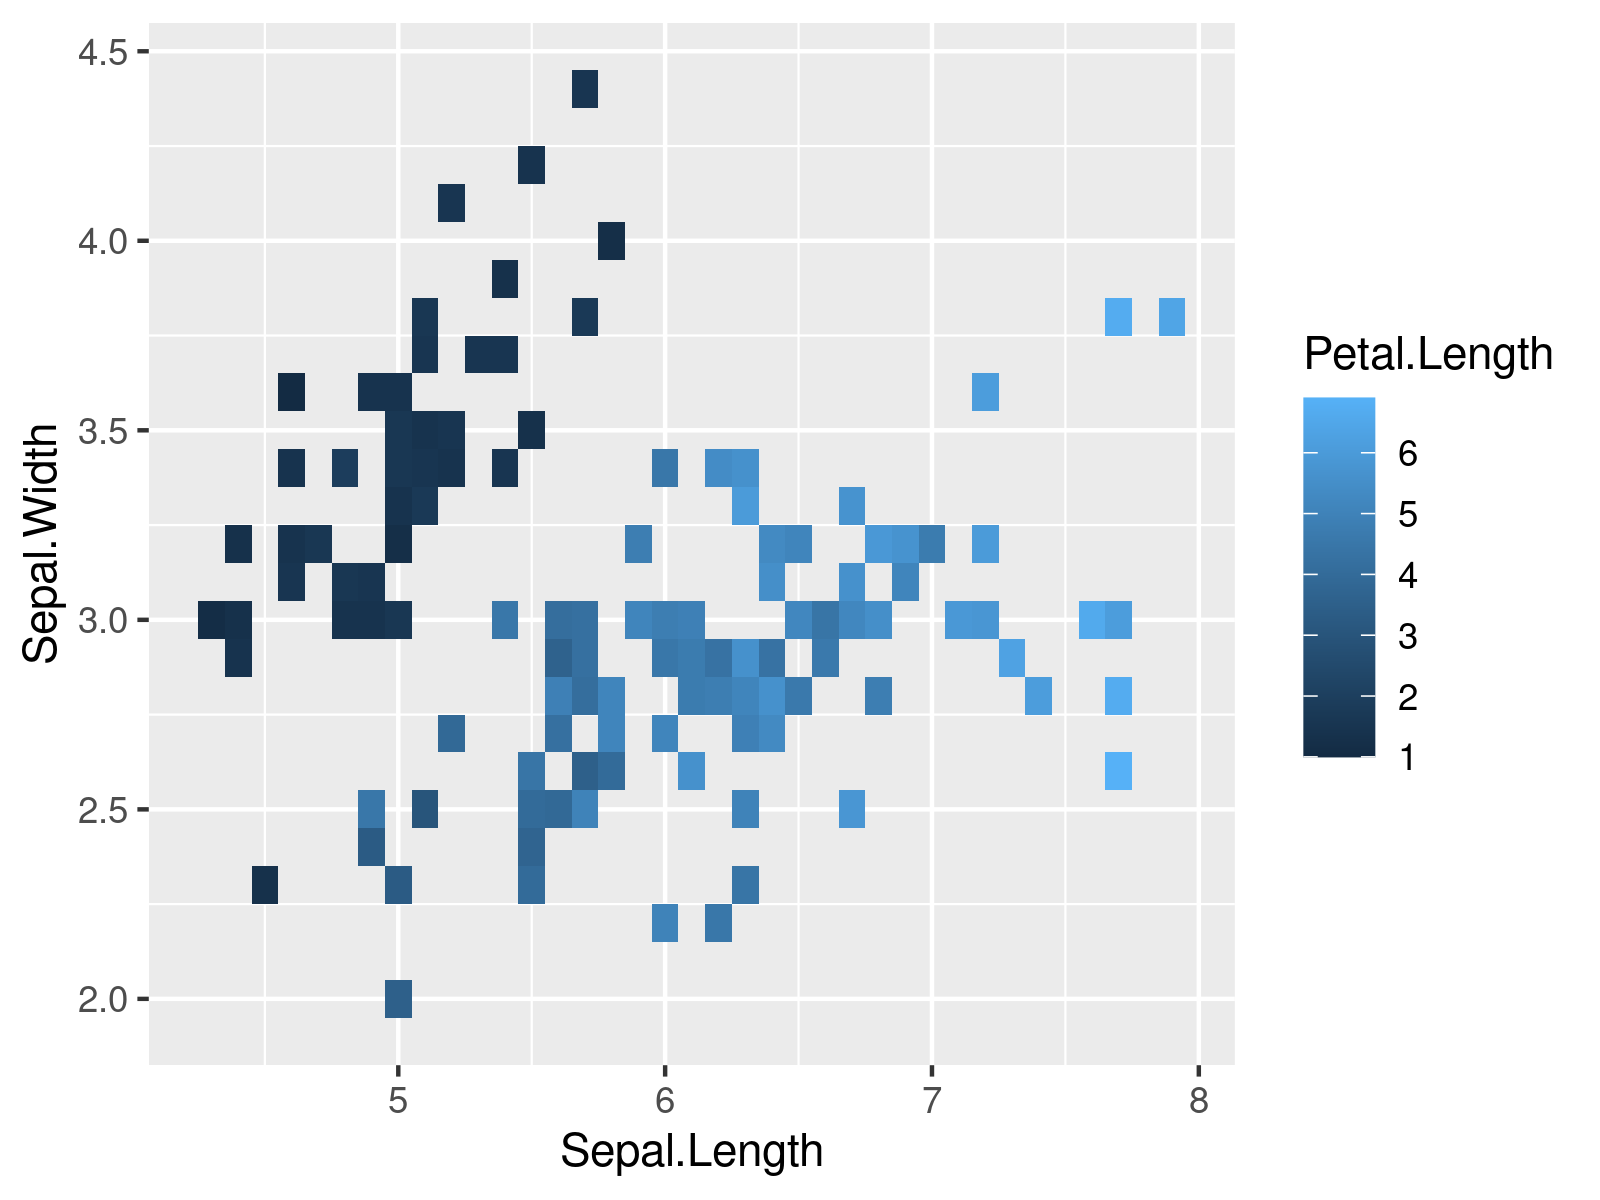
ggp <- ggplot(iris, # ggplot2 geom_tile plot aes(x = Sepal.Length, y = Sepal.Width, fill = Petal.Length)) + geom_tile() ggp |
ggp <- ggplot(iris, # ggplot2 geom_tile plot aes(x = Sepal.Length, y = Sepal.Width, fill = Petal.Length)) + geom_tile() ggp

Example: Applying scale_fill_gradientn() Function to Specify Color Ranges
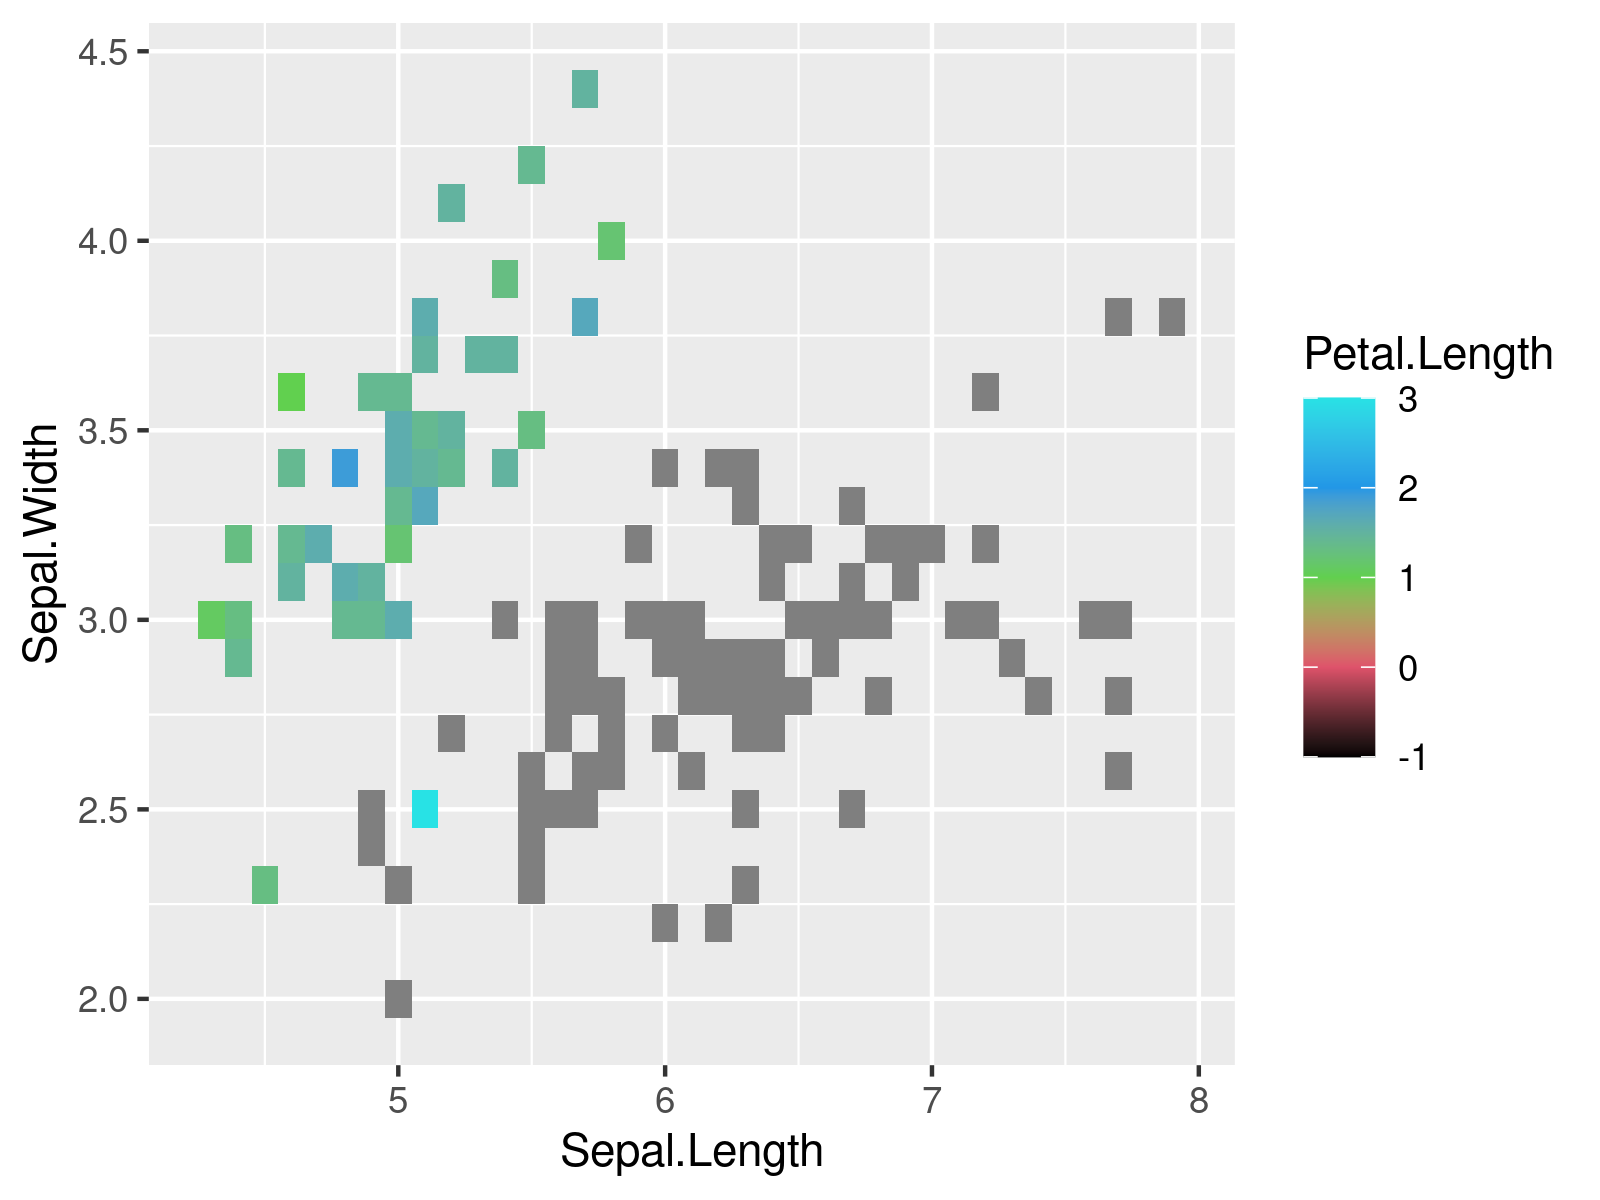
ggp + # Specifying color ranges scale_fill_gradientn(colors = c(1:5), limits = c(- 1, 3), breaks = c(- 1, 0, 1, 2, 3)) |
ggp + # Specifying color ranges scale_fill_gradientn(colors = c(1:5), limits = c(- 1, 3), breaks = c(- 1, 0, 1, 2, 3))

Related Articles & Further Resources
Have a look at the following R tutorials. They illustrate topics such as coding errors, graphics in R, colors, and ggplot2.
