Remove Overlap for geom_text Labels in ggplot2 Plot in R (Example Code)
In this R programming tutorial you’ll learn how to avoid overlap for geom_text labels in a ggplot2 plot.
Setting up the Example
set.seed(7587364727) # Load & modify example data data(iris) iris_sub <- iris[sample(1:nrow(iris), 20), ] iris_sub # Sepal.Length Sepal.Width Petal.Length Petal.Width Species # 116 6.4 3.2 5.3 2.3 virginica # 22 5.1 3.7 1.5 0.4 setosa # 68 5.8 2.7 4.1 1.0 versicolor # 125 6.7 3.3 5.7 2.1 virginica # 118 7.7 3.8 6.7 2.2 virginica # 27 5.0 3.4 1.6 0.4 setosa # 140 6.9 3.1 5.4 2.1 virginica # 146 6.7 3.0 5.2 2.3 virginica # 12 4.8 3.4 1.6 0.2 setosa # 38 4.9 3.6 1.4 0.1 setosa # 59 6.6 2.9 4.6 1.3 versicolor # 97 5.7 2.9 4.2 1.3 versicolor # 79 6.0 2.9 4.5 1.5 versicolor # 3 4.7 3.2 1.3 0.2 setosa # 92 6.1 3.0 4.6 1.4 versicolor # 122 5.6 2.8 4.9 2.0 virginica # 5 5.0 3.6 1.4 0.2 setosa # 28 5.2 3.5 1.5 0.2 setosa # 62 5.9 3.0 4.2 1.5 versicolor # 76 6.6 3.0 4.4 1.4 versicolor |
set.seed(7587364727) # Load & modify example data data(iris) iris_sub <- iris[sample(1:nrow(iris), 20), ] iris_sub # Sepal.Length Sepal.Width Petal.Length Petal.Width Species # 116 6.4 3.2 5.3 2.3 virginica # 22 5.1 3.7 1.5 0.4 setosa # 68 5.8 2.7 4.1 1.0 versicolor # 125 6.7 3.3 5.7 2.1 virginica # 118 7.7 3.8 6.7 2.2 virginica # 27 5.0 3.4 1.6 0.4 setosa # 140 6.9 3.1 5.4 2.1 virginica # 146 6.7 3.0 5.2 2.3 virginica # 12 4.8 3.4 1.6 0.2 setosa # 38 4.9 3.6 1.4 0.1 setosa # 59 6.6 2.9 4.6 1.3 versicolor # 97 5.7 2.9 4.2 1.3 versicolor # 79 6.0 2.9 4.5 1.5 versicolor # 3 4.7 3.2 1.3 0.2 setosa # 92 6.1 3.0 4.6 1.4 versicolor # 122 5.6 2.8 4.9 2.0 virginica # 5 5.0 3.6 1.4 0.2 setosa # 28 5.2 3.5 1.5 0.2 setosa # 62 5.9 3.0 4.2 1.5 versicolor # 76 6.6 3.0 4.4 1.4 versicolor
install.packages("ggplot2") # Install ggplot2 package library("ggplot2") # Load ggplot2 |
install.packages("ggplot2") # Install ggplot2 package library("ggplot2") # Load ggplot2
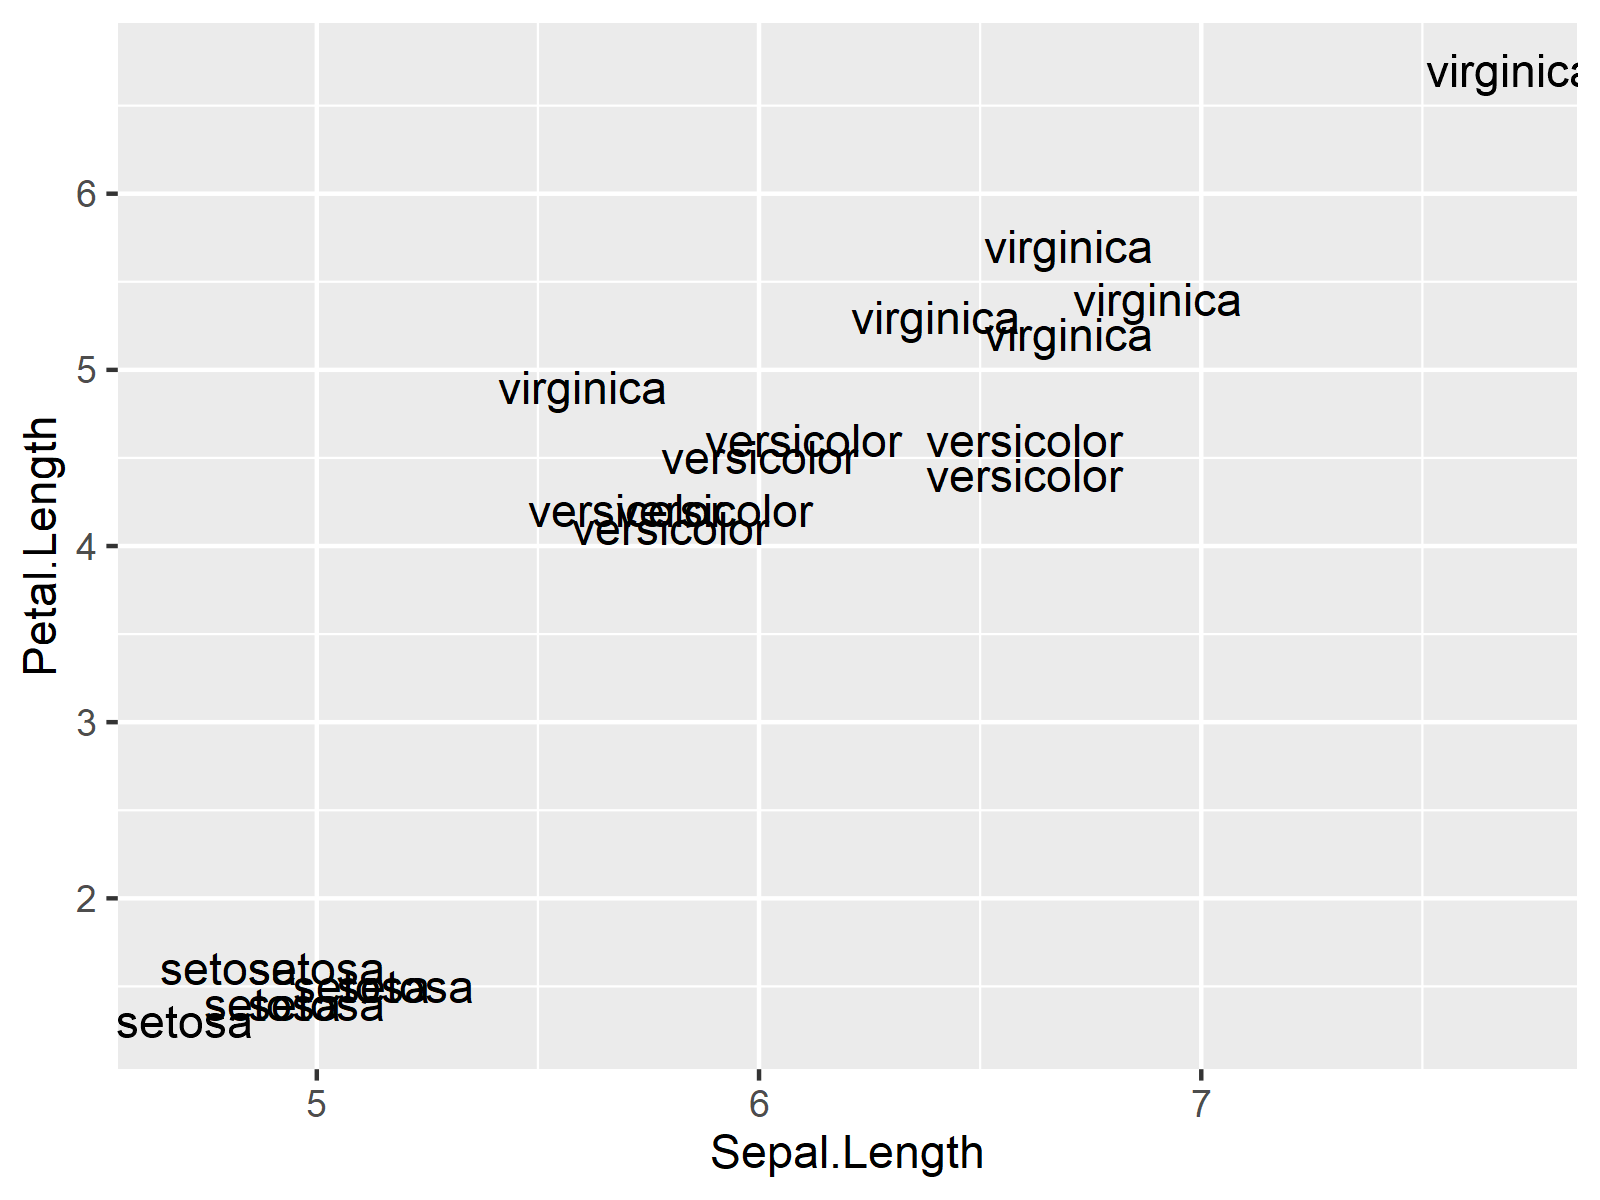
ggplot(iris_sub) + # ggplot2 plot with overlapping text labels geom_text(aes(x = Sepal.Length, y = Petal.Length, label = Species)) |
ggplot(iris_sub) + # ggplot2 plot with overlapping text labels geom_text(aes(x = Sepal.Length, y = Petal.Length, label = Species))

Example: Draw ggplot2 Text Labels without Overlap Using geom_text_repel() Function of ggrepel Package
install.packages("ggrepel") # Install ggrepel package library("ggrepel") # Load ggrepel package |
install.packages("ggrepel") # Install ggrepel package library("ggrepel") # Load ggrepel package
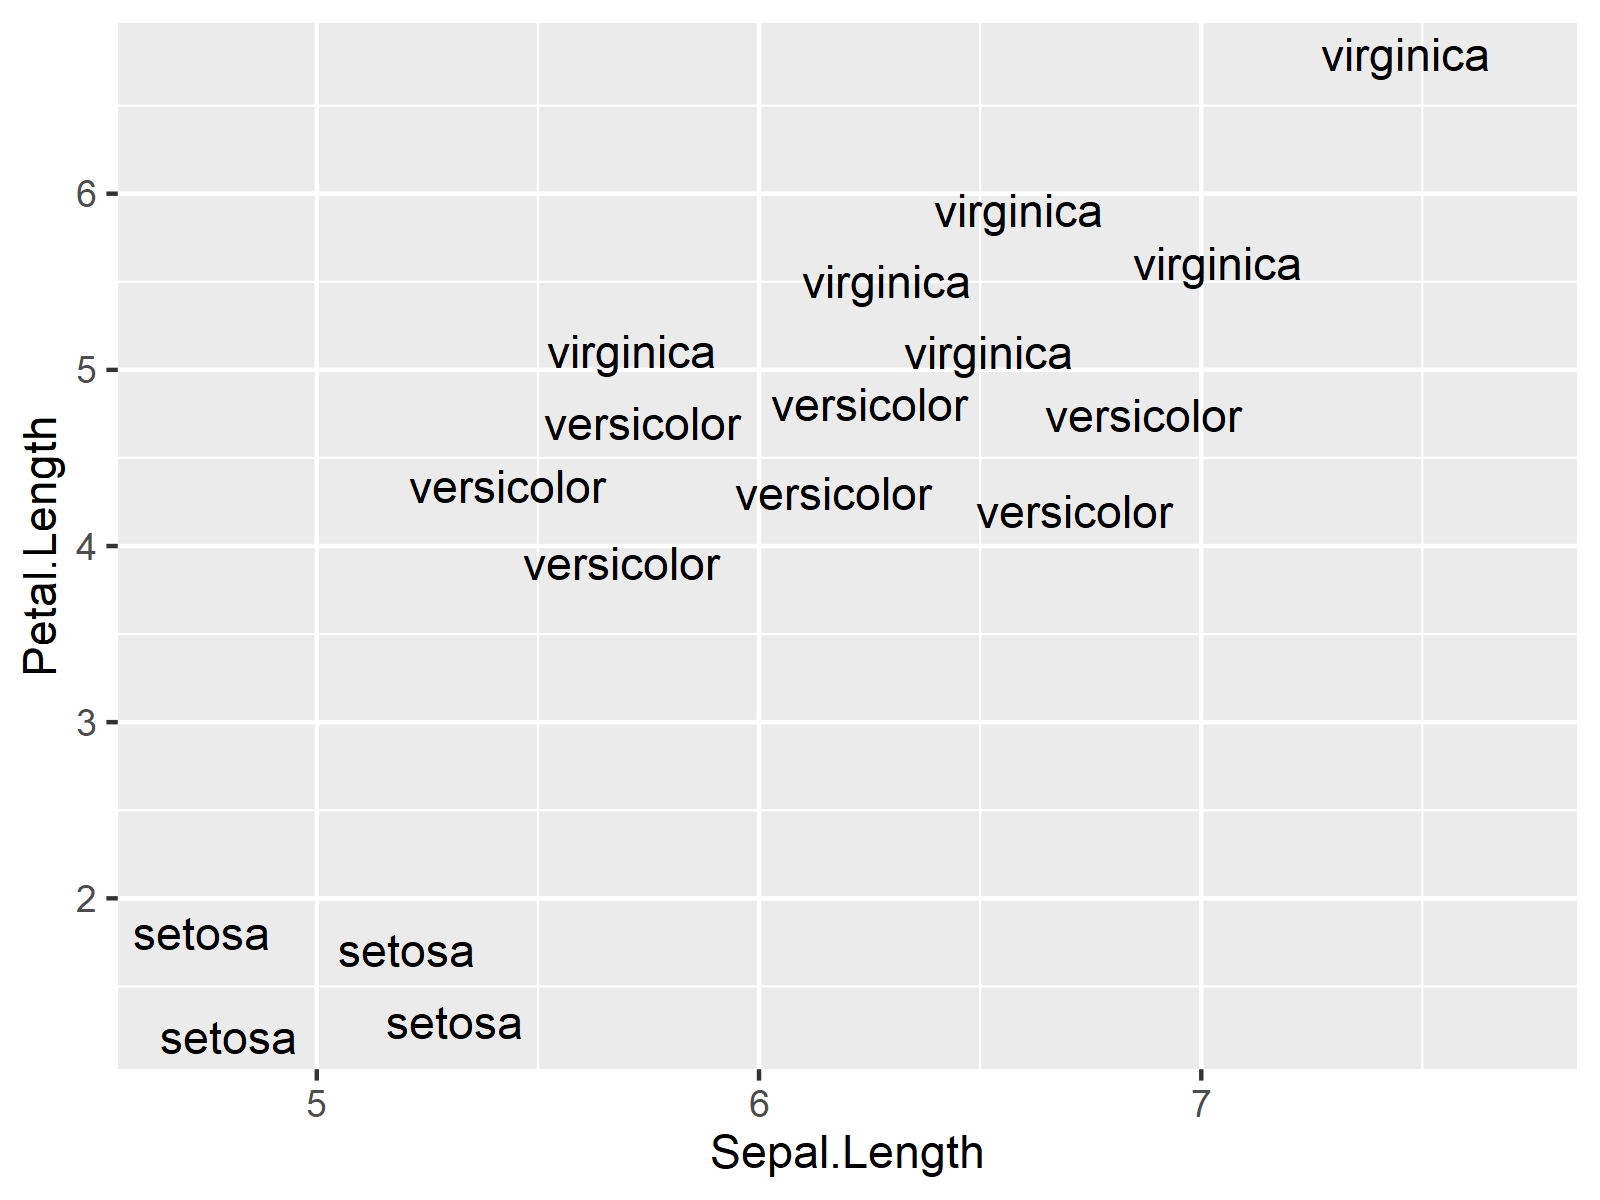
ggplot(iris_sub) + # Remove overlap geom_text_repel(aes(x = Sepal.Length, y = Petal.Length, label = Species)) |
ggplot(iris_sub) + # Remove overlap geom_text_repel(aes(x = Sepal.Length, y = Petal.Length, label = Species))

Further Resources & Related Articles
Please find some related R programming tutorials on topics such as graphics in R, ggplot2, and text elements in the following list.
