Plotting Dates on X-Axis of Graphic in R (Example Code)
In this R tutorial you’ll learn how to plot dates on an x-axis.
Creation of Example Data
my_df <- data.frame(x = c("2010-11-05", "2013-07-21", # Example data frame in R "2021-10-15", "2018-03-09", "2022-12-02", "2017-02-05", "2019-05-03", "2017-12-15"), y = 11:18) my_df # Showing example data frame # x y # 1 2010-11-05 11 # 2 2013-07-21 12 # 3 2021-10-15 13 # 4 2018-03-09 14 # 5 2022-12-02 15 # 6 2017-02-05 16 # 7 2019-05-03 17 # 8 2017-12-15 18 |
my_df <- data.frame(x = c("2010-11-05", "2013-07-21", # Example data frame in R "2021-10-15", "2018-03-09", "2022-12-02", "2017-02-05", "2019-05-03", "2017-12-15"), y = 11:18) my_df # Showing example data frame # x y # 1 2010-11-05 11 # 2 2013-07-21 12 # 3 2021-10-15 13 # 4 2018-03-09 14 # 5 2022-12-02 15 # 6 2017-02-05 16 # 7 2019-05-03 17 # 8 2017-12-15 18
Example: Plotting Dates on X-Axis
my_df$x <- as.Date(my_df$x) # Converting column to Date class my_df <- my_df[order(my_df$x), ] # Ordering data frame my_df # Showing new data frame # x y # 1 2010-11-05 11 # 2 2013-07-21 12 # 6 2017-02-05 16 # 8 2017-12-15 18 # 4 2018-03-09 14 # 7 2019-05-03 17 # 3 2021-10-15 13 # 5 2022-12-02 15 |
my_df$x <- as.Date(my_df$x) # Converting column to Date class my_df <- my_df[order(my_df$x), ] # Ordering data frame my_df # Showing new data frame # x y # 1 2010-11-05 11 # 2 2013-07-21 12 # 6 2017-02-05 16 # 8 2017-12-15 18 # 4 2018-03-09 14 # 7 2019-05-03 17 # 3 2021-10-15 13 # 5 2022-12-02 15
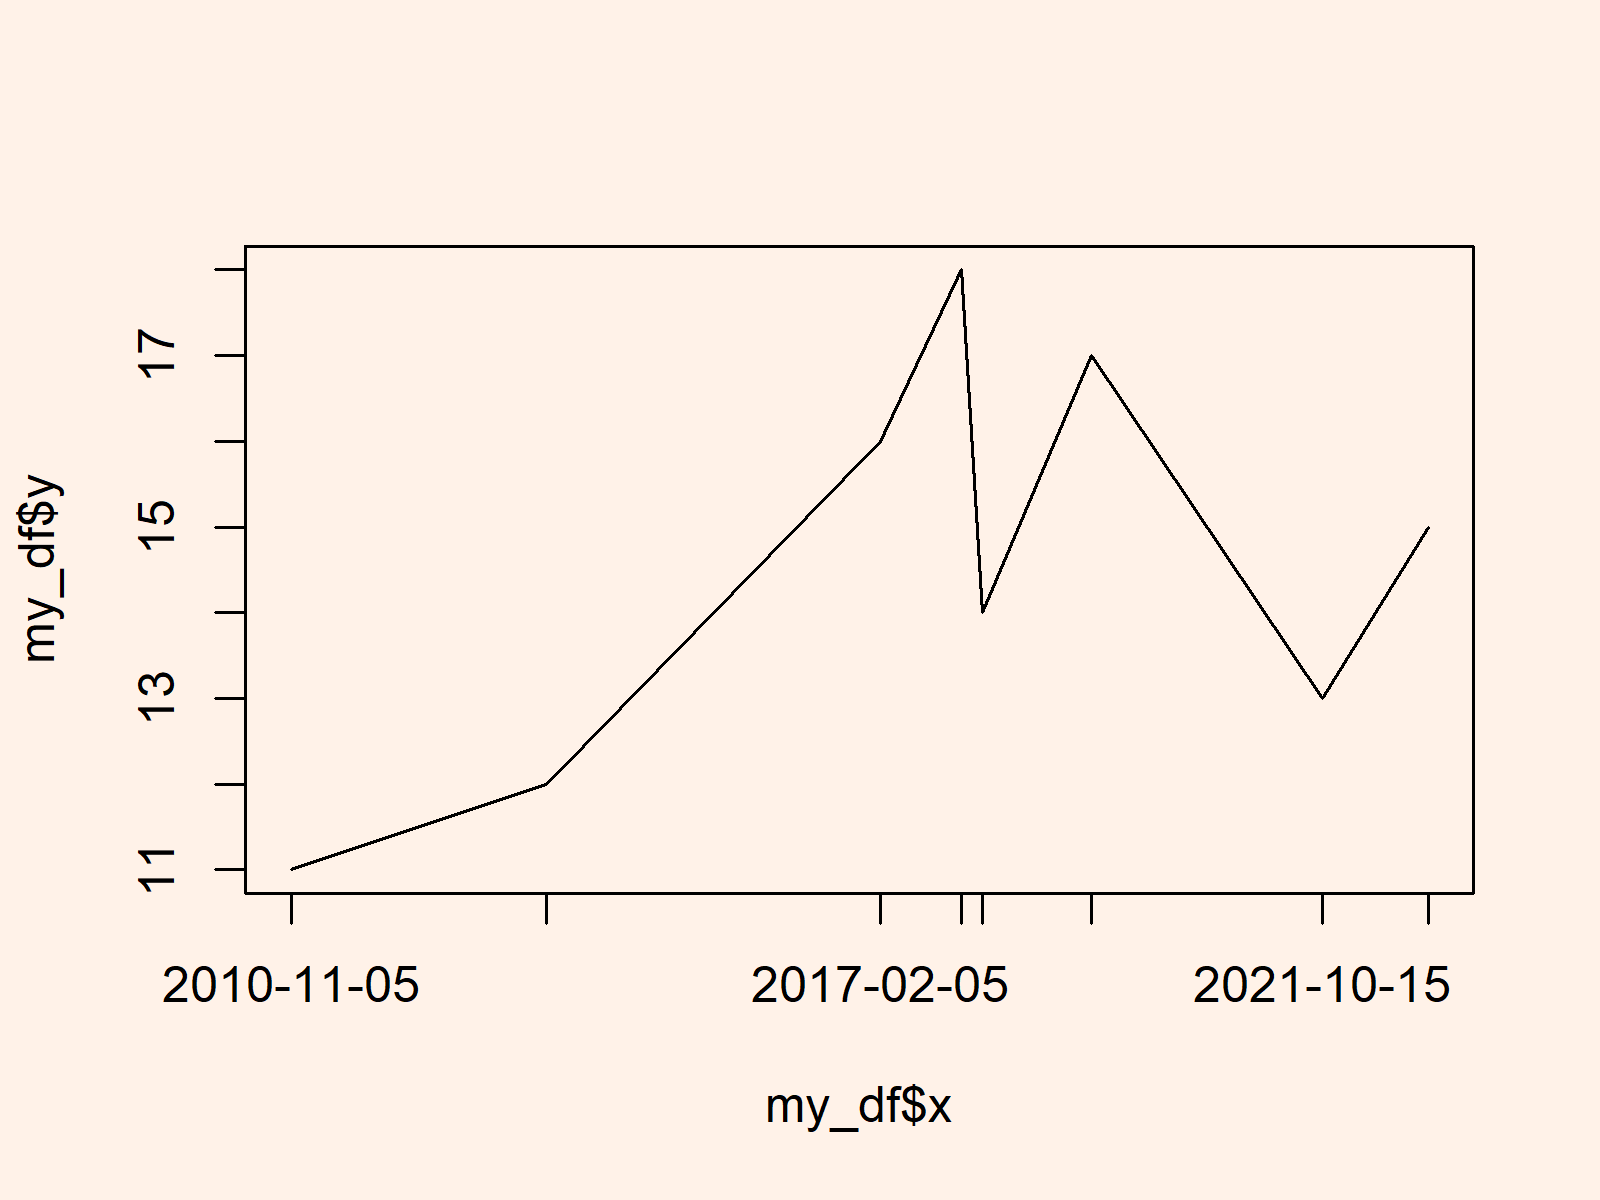
plot(my_df$x, my_df$y, xaxt = "n", type = "l") # Drawing plot without x-axis axis(1, my_df$x, format(my_df$x, "%Y-%m-%d")) # Printing dates to x-axis |
plot(my_df$x, my_df$y, xaxt = "n", type = "l") # Drawing plot without x-axis axis(1, my_df$x, format(my_df$x, "%Y-%m-%d")) # Printing dates to x-axis

Related Tutorials
Below, you may find some further resources on topics such as lines, variables, graphics in r, and ggplot2.
