ggplot2 Error in R: Invalid input: date_trans works with objects of class Date only (2 Examples)
In this tutorial you’ll learn how to handle the “Error: Invalid input: date_trans works with objects of class Date only” in the R programming language.
Preparing the Examples
my_df <- data.frame(dates = as.Date(c("2024-05-06", # Constructing data frame in R "2023-01-08", "2027-10-16", "2024-11-12", "2025-06-23")), values = 11:15) my_df # Displaying example data # dates values # 1 2024-05-06 11 # 2 2023-01-08 12 # 3 2027-10-16 13 # 4 2024-11-12 14 # 5 2025-06-23 15 |
my_df <- data.frame(dates = as.Date(c("2024-05-06", # Constructing data frame in R "2023-01-08", "2027-10-16", "2024-11-12", "2025-06-23")), values = 11:15) my_df # Displaying example data # dates values # 1 2024-05-06 11 # 2 2023-01-08 12 # 3 2027-10-16 13 # 4 2024-11-12 14 # 5 2025-06-23 15
install.packages("ggplot2") # Install ggplot2 package library("ggplot2") # Load ggplot2 package |
install.packages("ggplot2") # Install ggplot2 package library("ggplot2") # Load ggplot2 package
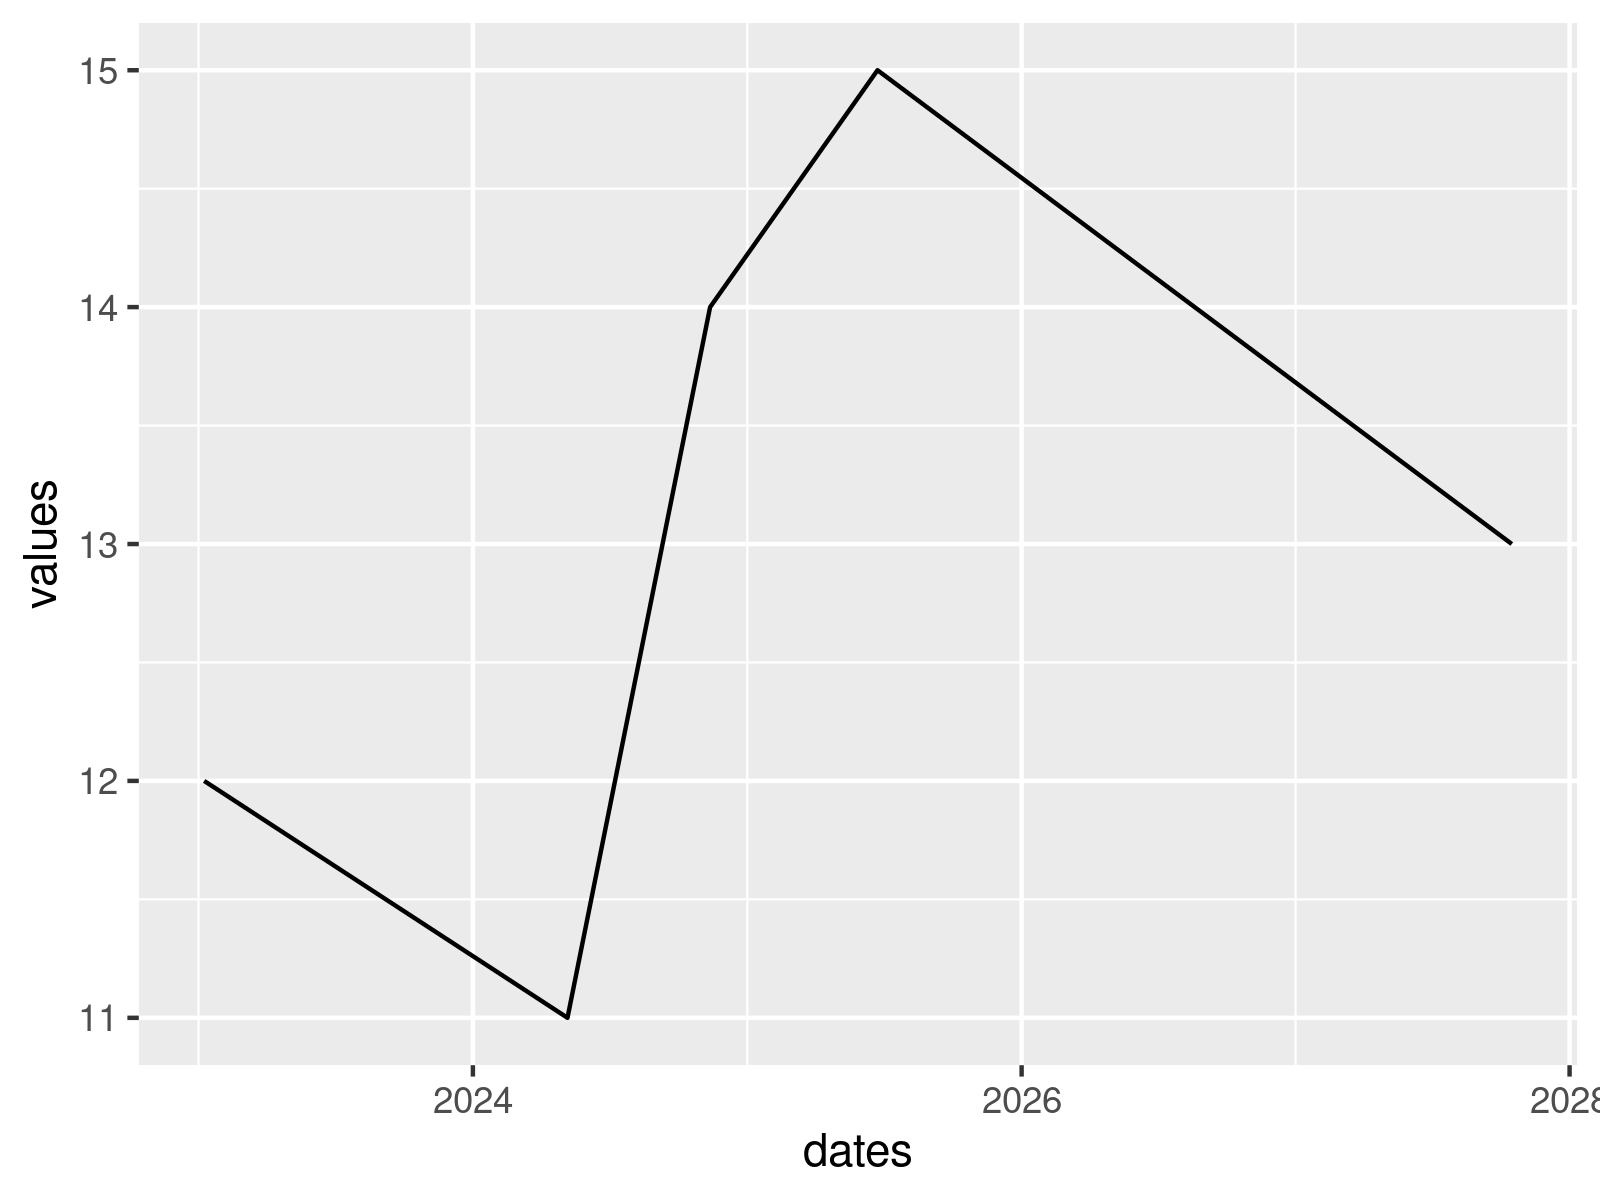
my_plot <- ggplot(my_df, # ggplot2 plot without geom_rect aes(x = dates, y = values)) + geom_line() my_plot |
my_plot <- ggplot(my_df, # ggplot2 plot without geom_rect aes(x = dates, y = values)) + geom_line() my_plot

Example 1: Replicating the Error Message – Invalid input: date_trans works with objects of class Date only
my_plot + # geom_rect without as.Date function geom_rect(data = my_df, aes(xmin = "2025-01-01", xmax = "2027-01-01", ymin = -Inf, ymax = Inf), fill = "red", alpha = 0.3) # Error: Invalid input: date_trans works with objects of class Date only |
my_plot + # geom_rect without as.Date function geom_rect(data = my_df, aes(xmin = "2025-01-01", xmax = "2027-01-01", ymin = -Inf, ymax = Inf), fill = "red", alpha = 0.3) # Error: Invalid input: date_trans works with objects of class Date only
Example 2: Fixing the Error Message – Invalid input: date_trans works with objects of class Date only
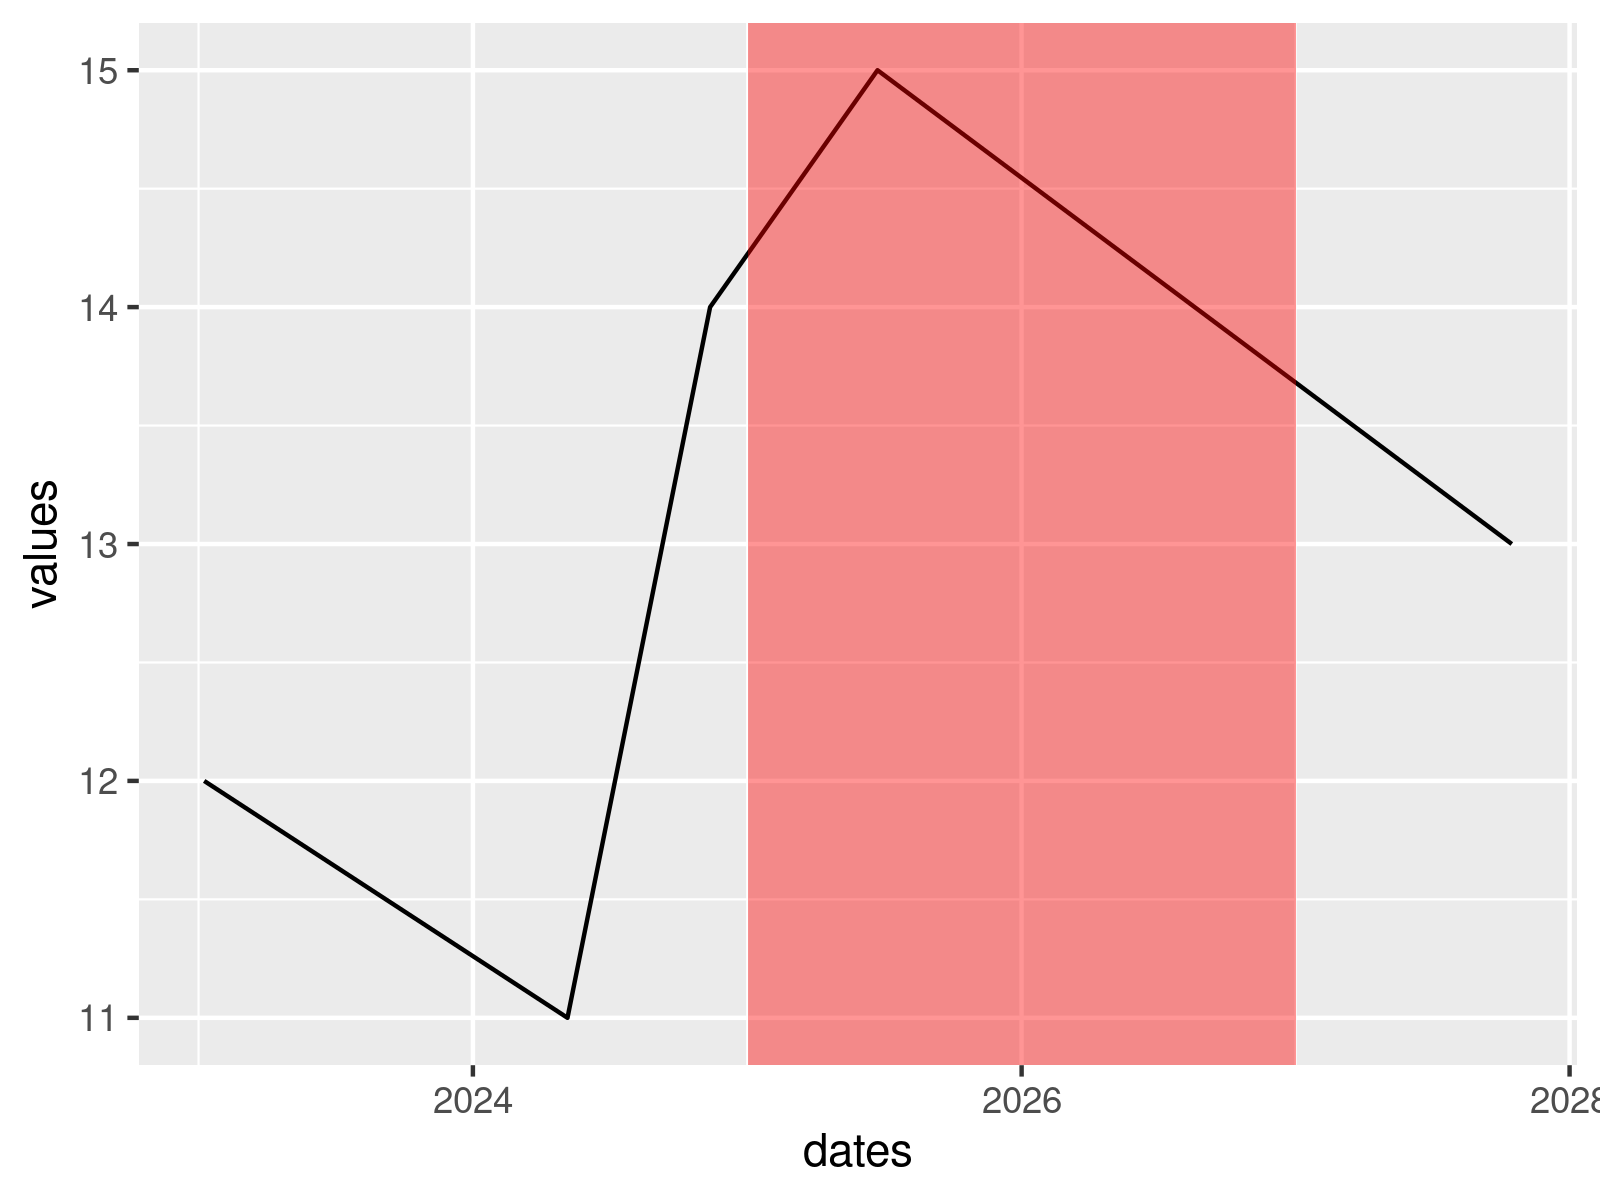
my_plot + # geom_rect with as.Date function geom_rect(data = my_df, aes(xmin = as.Date("2025-01-01"), xmax = as.Date("2027-01-01"), ymin = -Inf, ymax = Inf), fill = "red", alpha = 0.1) |
my_plot + # geom_rect with as.Date function geom_rect(data = my_df, aes(xmin = as.Date("2025-01-01"), xmax = as.Date("2027-01-01"), ymin = -Inf, ymax = Inf), fill = "red", alpha = 0.1)

Related Articles & Further Resources
Have a look at the following R tutorials. They illustrate topics such as graphics in R, dates, and ggplot2.
