R stripchart.default Error – invalid plotting method (2 Examples)
This article explains how to avoid the “Error in stripchart.default(x1, …) : invalid plotting method” in R programming.
Creating Example Data
data(iris) # Example data frame head(iris) # Sepal.Length Sepal.Width Petal.Length Petal.Width Species # 1 5.1 3.5 1.4 0.2 setosa # 2 4.9 3.0 1.4 0.2 setosa # 3 4.7 3.2 1.3 0.2 setosa # 4 4.6 3.1 1.5 0.2 setosa # 5 5.0 3.6 1.4 0.2 setosa # 6 5.4 3.9 1.7 0.4 setosa |
data(iris) # Example data frame head(iris) # Sepal.Length Sepal.Width Petal.Length Petal.Width Species # 1 5.1 3.5 1.4 0.2 setosa # 2 4.9 3.0 1.4 0.2 setosa # 3 4.7 3.2 1.3 0.2 setosa # 4 4.6 3.1 1.5 0.2 setosa # 5 5.0 3.6 1.4 0.2 setosa # 6 5.4 3.9 1.7 0.4 setosa
Example 1: Reproducing the Error Message : invalid plotting method
plot(iris[1], iris[2]) # Try to create plot # Error in stripchart.default(x1, ...) : invalid plotting method |
plot(iris[1], iris[2]) # Try to create plot # Error in stripchart.default(x1, ...) : invalid plotting method
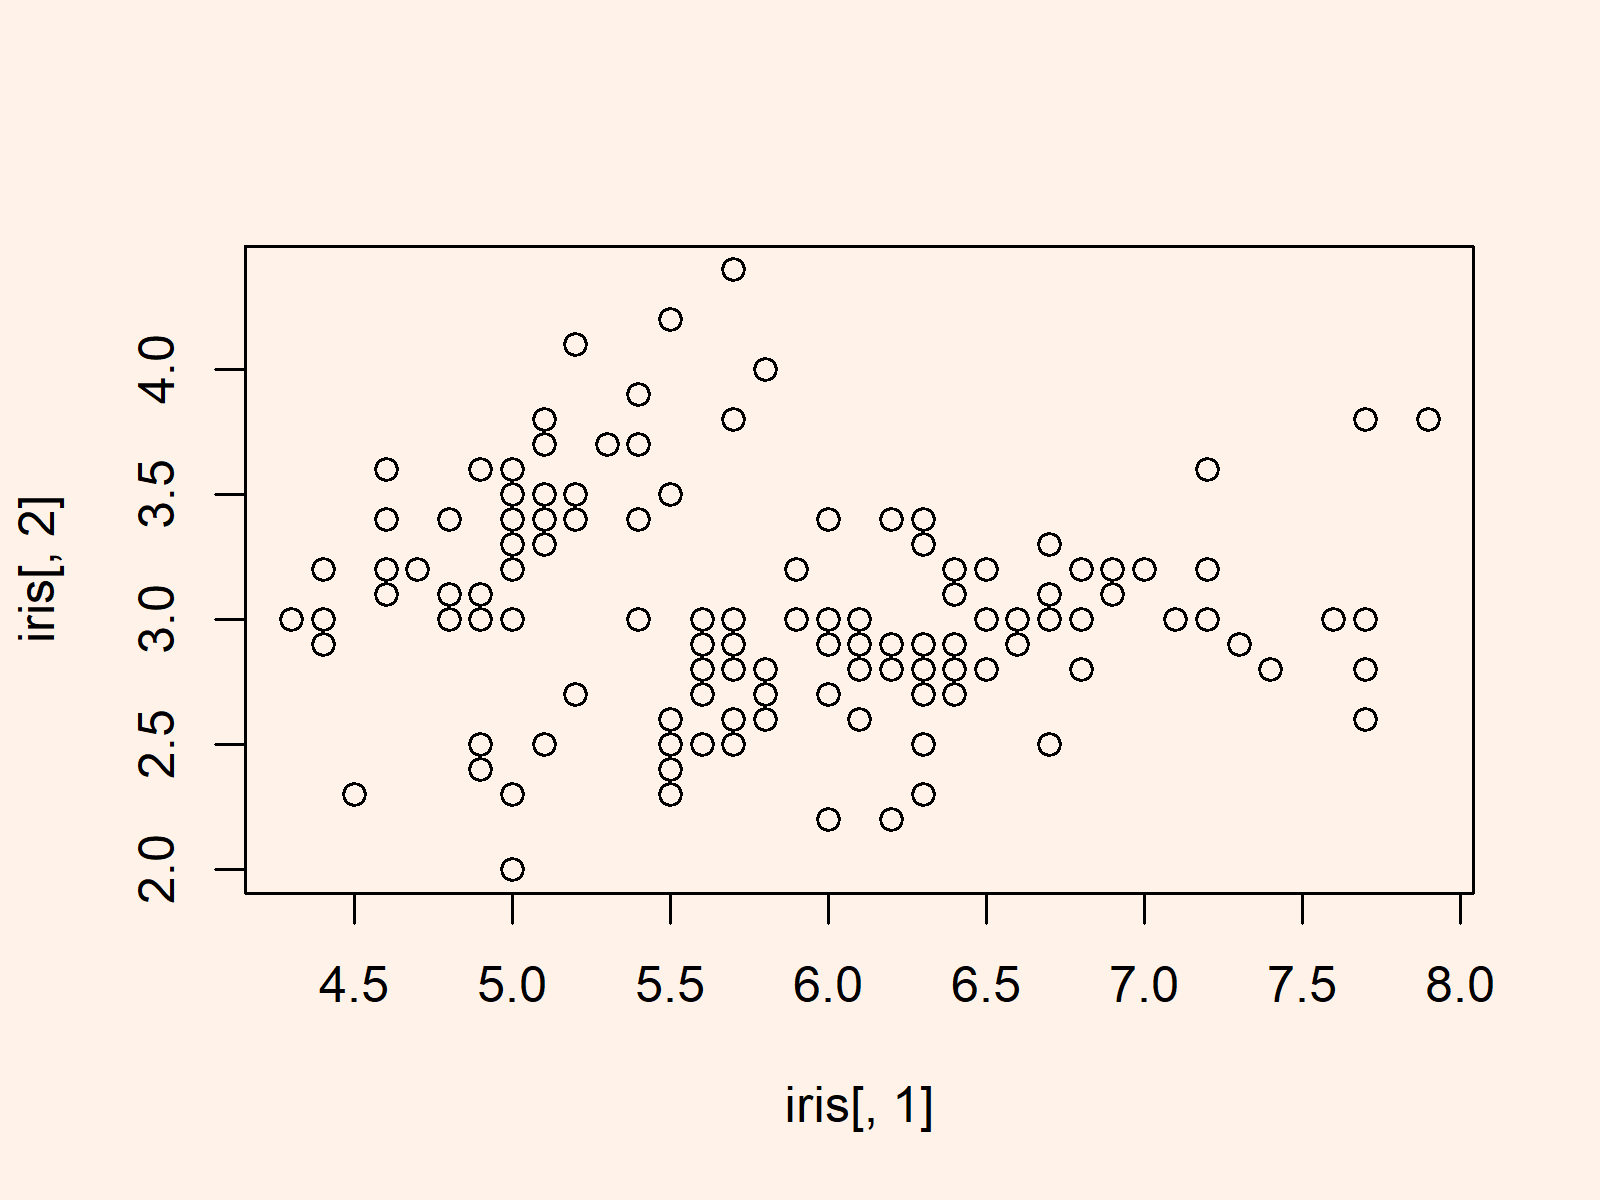
Example 2: Solving the Error Message : invalid plotting method
plot(iris[ , 1], iris[ , 2]) # Apply plot function to proper data |
plot(iris[ , 1], iris[ , 2]) # Apply plot function to proper data

