ggplot2 Error in R: Insufficient values in manual scale. N needed but only M provided. (2 Examples)
This article demonstrates how to avoid the “Error: Insufficient values in manual scale. X needed but only Y provided.” in R.
Setting up the Examples
data(iris) # Example data head(iris) # Sepal.Length Sepal.Width Petal.Length Petal.Width Species # 1 5.1 3.5 1.4 0.2 setosa # 2 4.9 3.0 1.4 0.2 setosa # 3 4.7 3.2 1.3 0.2 setosa # 4 4.6 3.1 1.5 0.2 setosa # 5 5.0 3.6 1.4 0.2 setosa # 6 5.4 3.9 1.7 0.4 setosa |
data(iris) # Example data head(iris) # Sepal.Length Sepal.Width Petal.Length Petal.Width Species # 1 5.1 3.5 1.4 0.2 setosa # 2 4.9 3.0 1.4 0.2 setosa # 3 4.7 3.2 1.3 0.2 setosa # 4 4.6 3.1 1.5 0.2 setosa # 5 5.0 3.6 1.4 0.2 setosa # 6 5.4 3.9 1.7 0.4 setosa
install.packages("ggplot2") # Install ggplot2 package library("ggplot2") # Load ggplot2 |
install.packages("ggplot2") # Install ggplot2 package library("ggplot2") # Load ggplot2
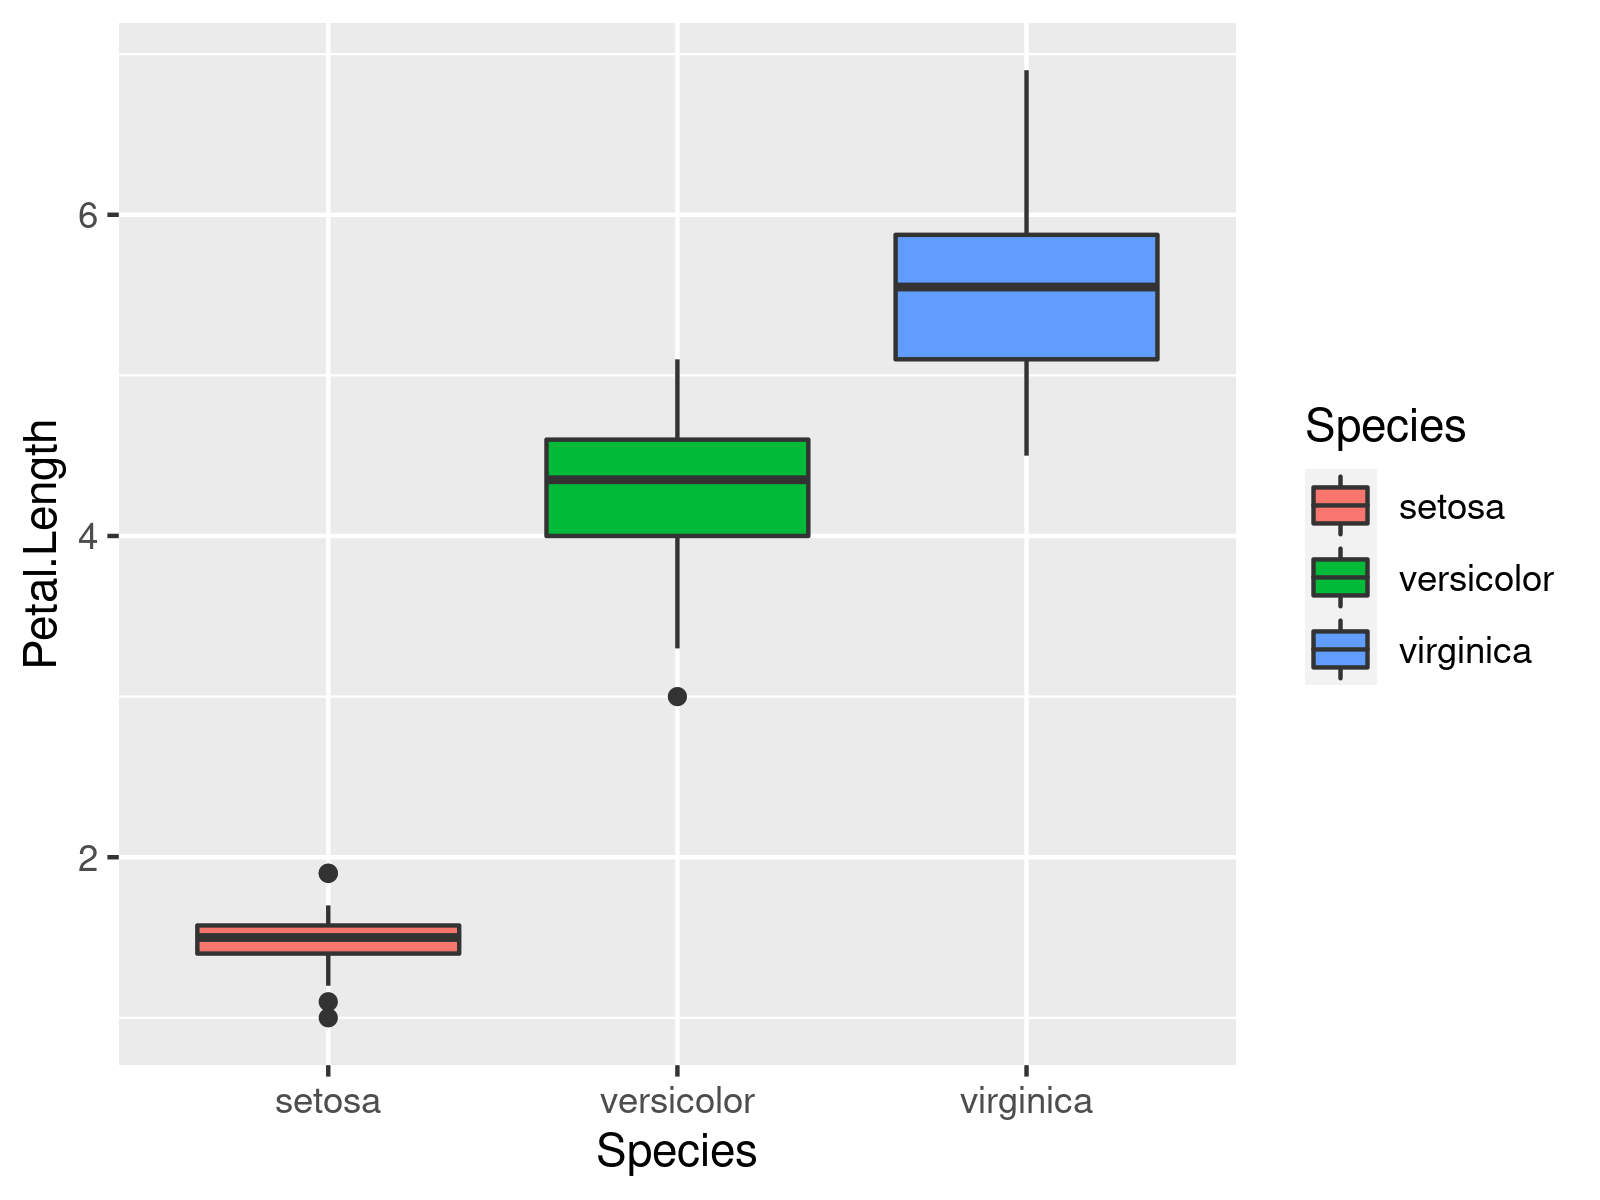
my_plot <- ggplot(iris, # Default colors aes(x = Species, y = Petal.Length, fill = Species)) + geom_boxplot() my_plot |
my_plot <- ggplot(iris, # Default colors aes(x = Species, y = Petal.Length, fill = Species)) + geom_boxplot() my_plot

Example 1: Replicating the Error Message – Insufficient values in manual scale. 3 needed but only 2 provided.
my_plot + # Not enough colors scale_fill_manual(values = c("red", "green")) # Error: Insufficient values in manual scale. 3 needed but only 2 provided. |
my_plot + # Not enough colors scale_fill_manual(values = c("red", "green")) # Error: Insufficient values in manual scale. 3 needed but only 2 provided.
Example 2: Fixing the Error Message – Insufficient values in manual scale. 3 needed but only 2 provided.
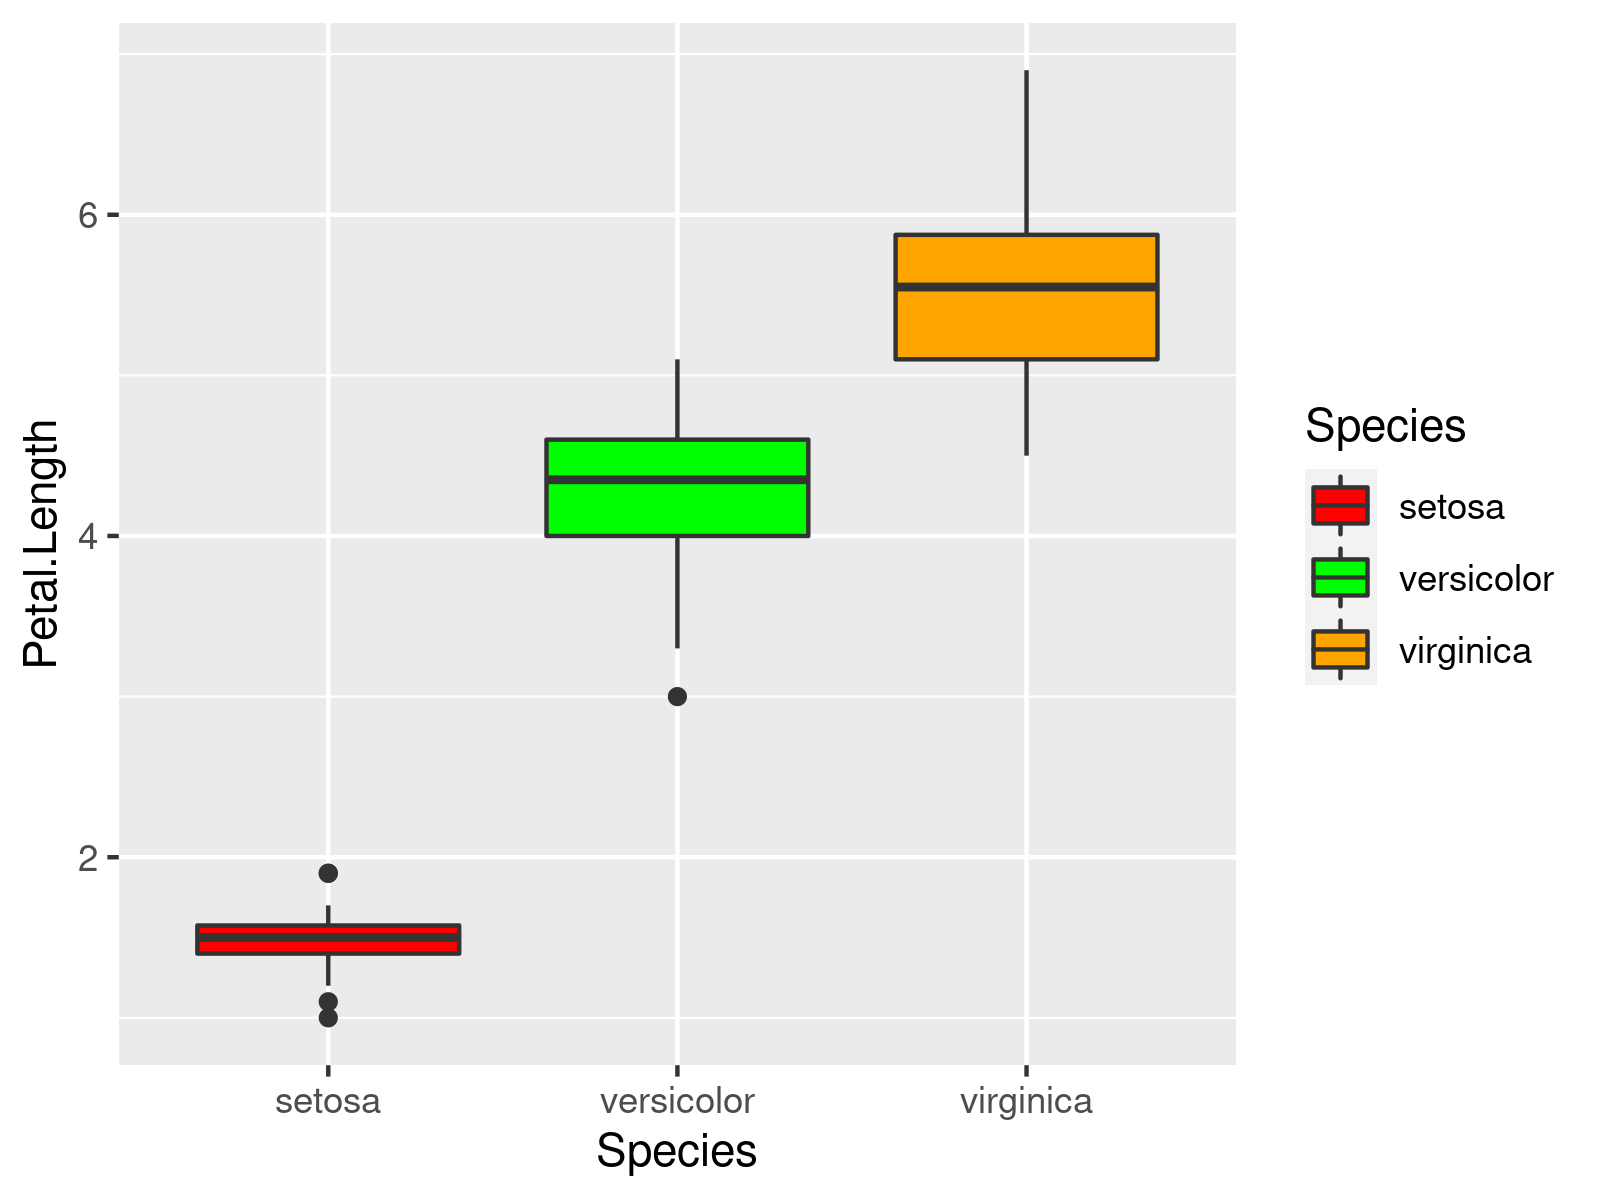
my_plot + # Same amount of boxes & colors scale_fill_manual(values = c("red", "green", "orange")) |
my_plot + # Same amount of boxes & colors scale_fill_manual(values = c("red", "green", "orange"))

Further Resources & Related Tutorials
You may find some related R tutorials on topics such as coding errors, graphics in R, and ggplot2 below.
- ggplot2 Error in R: Continuous value supplied to discrete scale
- Error in ggplot2 – must be data frame not integer
- ggplot2 Error Message: Cannot use with single argument
- Reverse Y-Axis Scale of Base R & ggplot2 Graph
- ggplot2 Error in R – Don’t know how to automatically pick scale for object of type function
