R ggplot2 Error Message: Cannot use with single argument (2 Examples)
In this tutorial you’ll learn how to avoid the error message “Cannot use `+.gg()` with a single argument” in R programming.
Preparing the Examples
data(iris) # Loading iris head(iris) # Sepal.Length Sepal.Width Petal.Length Petal.Width Species # 1 5.1 3.5 1.4 0.2 setosa # 2 4.9 3.0 1.4 0.2 setosa # 3 4.7 3.2 1.3 0.2 setosa # 4 4.6 3.1 1.5 0.2 setosa # 5 5.0 3.6 1.4 0.2 setosa # 6 5.4 3.9 1.7 0.4 setosa |
data(iris) # Loading iris head(iris) # Sepal.Length Sepal.Width Petal.Length Petal.Width Species # 1 5.1 3.5 1.4 0.2 setosa # 2 4.9 3.0 1.4 0.2 setosa # 3 4.7 3.2 1.3 0.2 setosa # 4 4.6 3.1 1.5 0.2 setosa # 5 5.0 3.6 1.4 0.2 setosa # 6 5.4 3.9 1.7 0.4 setosa
install.packages("ggplot2") # Install ggplot2 package library("ggplot2") # Load ggplot2 package |
install.packages("ggplot2") # Install ggplot2 package library("ggplot2") # Load ggplot2 package
Example 1: Replicating the Error Message: Cannot use `+.gg()` with a single argument.
ggplot(iris, aes(Sepal.Length, Petal.Length)) # + sign at wrong position + geom_point() # Error: Cannot use `+.gg()` with a single argument. Did you accidentally put + on a new line? # Run `rlang::last_error()` to see where the error occurred. |
ggplot(iris, aes(Sepal.Length, Petal.Length)) # + sign at wrong position + geom_point() # Error: Cannot use `+.gg()` with a single argument. Did you accidentally put + on a new line? # Run `rlang::last_error()` to see where the error occurred.
Example 2: Solving the Error Message: Cannot use `+.gg()` with a single argument.
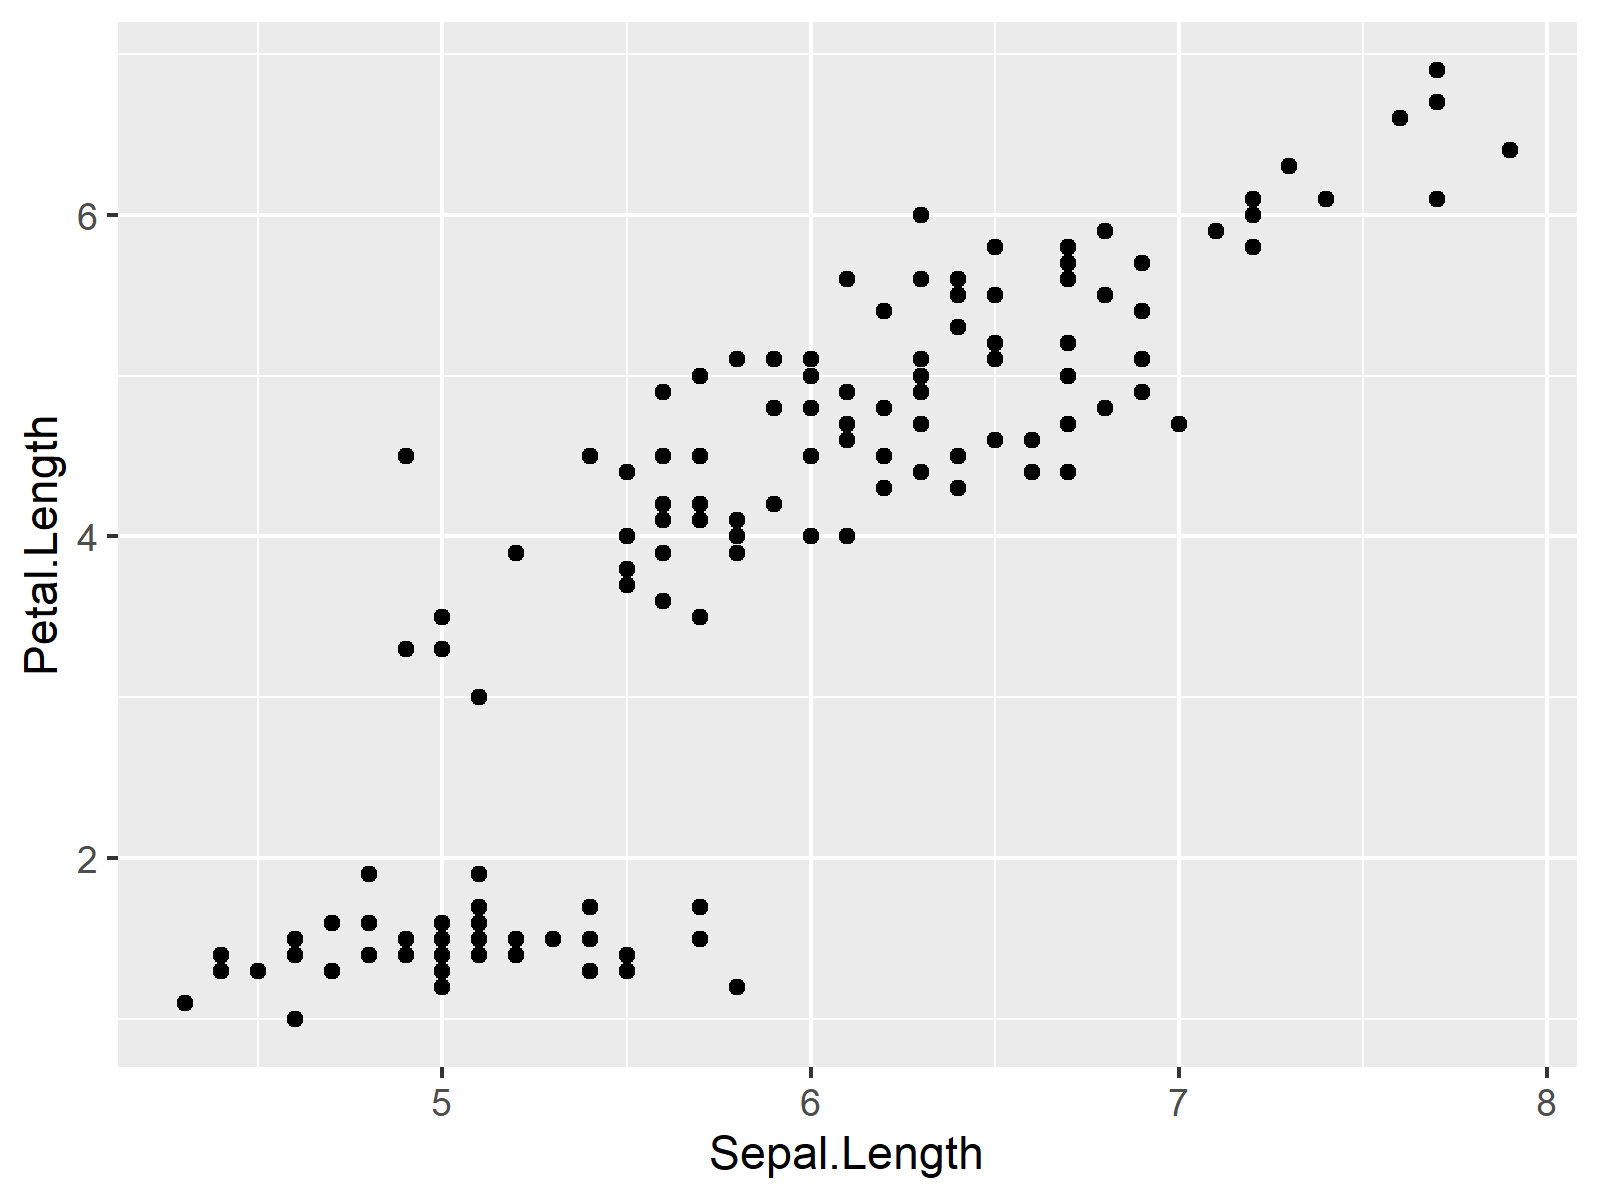
ggplot(iris, aes(Sepal.Length, Petal.Length)) + # + sign at correct position geom_point() |
ggplot(iris, aes(Sepal.Length, Petal.Length)) + # + sign at correct position geom_point()

Related Tutorials & Further Resources
In addition, you may want to have a look at the other articles that I have published on this website:
