ggplot2 Error in R: Continuous value supplied to discrete scale (2 Examples)
In this tutorial you’ll learn how to deal with the “Error: Continuous value supplied to discrete scale” in the R programming language.
Preparing the Examples
data(iris) # Loading iris as example data iris$Petal.Width.Groups <- 1 # Modify iris data iris$Petal.Width.Groups[iris$Petal.Width > 1 & iris$Petal.Width <= 2] <- 2 iris$Petal.Width.Groups[iris$Petal.Width > 2] <- 3 head(iris) # Sepal.Length Sepal.Width Petal.Length Petal.Width Species Petal.Width.Groups # 1 5.1 3.5 1.4 0.2 setosa 1 # 2 4.9 3.0 1.4 0.2 setosa 1 # 3 4.7 3.2 1.3 0.2 setosa 1 # 4 4.6 3.1 1.5 0.2 setosa 1 # 5 5.0 3.6 1.4 0.2 setosa 1 # 6 5.4 3.9 1.7 0.4 setosa 1 |
data(iris) # Loading iris as example data iris$Petal.Width.Groups <- 1 # Modify iris data iris$Petal.Width.Groups[iris$Petal.Width > 1 & iris$Petal.Width <= 2] <- 2 iris$Petal.Width.Groups[iris$Petal.Width > 2] <- 3 head(iris) # Sepal.Length Sepal.Width Petal.Length Petal.Width Species Petal.Width.Groups # 1 5.1 3.5 1.4 0.2 setosa 1 # 2 4.9 3.0 1.4 0.2 setosa 1 # 3 4.7 3.2 1.3 0.2 setosa 1 # 4 4.6 3.1 1.5 0.2 setosa 1 # 5 5.0 3.6 1.4 0.2 setosa 1 # 6 5.4 3.9 1.7 0.4 setosa 1
install.packages("ggplot2") # Install ggplot2 package library("ggplot2") # Load ggplot2 |
install.packages("ggplot2") # Install ggplot2 package library("ggplot2") # Load ggplot2
Example 1: Replicating the Error Message – Continuous value supplied to discrete scale
ggplot(iris, aes(x = Petal.Length, # Adding colors leads to error group = Petal.Width.Groups, color = Petal.Width.Groups)) + geom_boxplot() + scale_color_manual(values = c("red", "green", "blue")) # Error: Continuous value supplied to discrete scale |
ggplot(iris, aes(x = Petal.Length, # Adding colors leads to error group = Petal.Width.Groups, color = Petal.Width.Groups)) + geom_boxplot() + scale_color_manual(values = c("red", "green", "blue")) # Error: Continuous value supplied to discrete scale
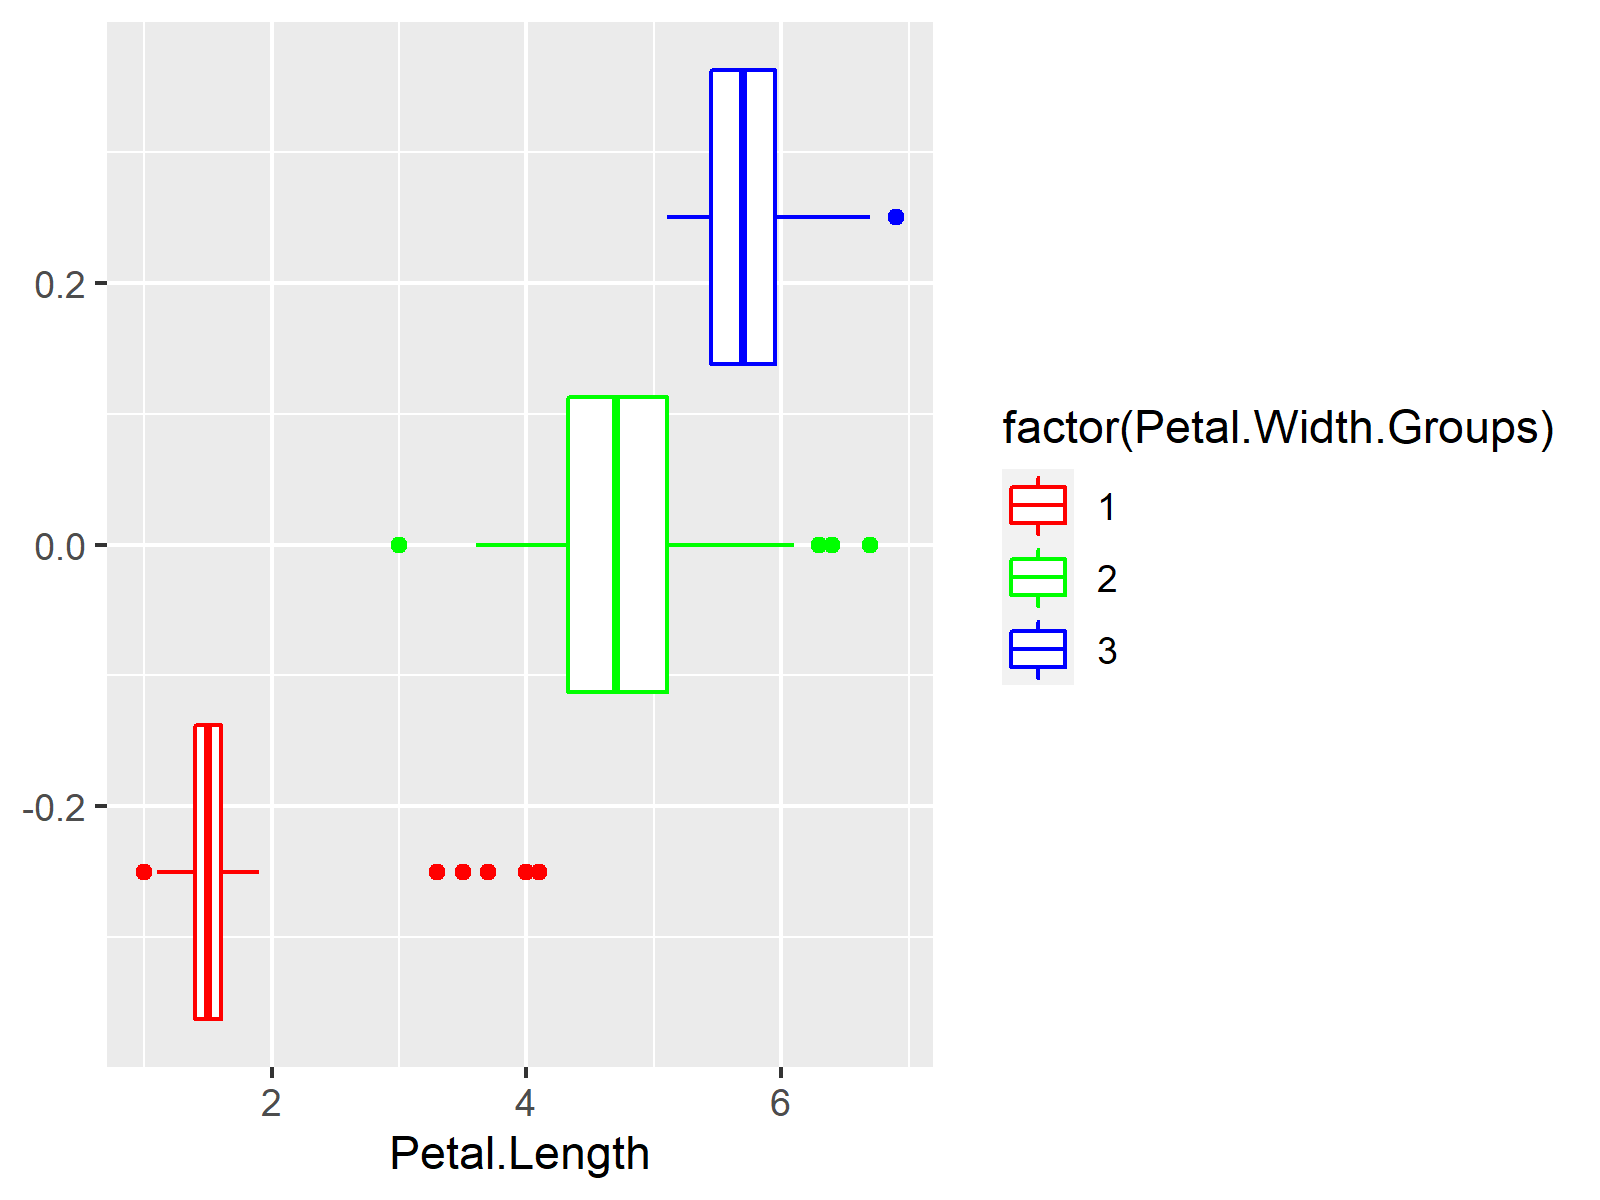
Example 2: Solving the Error Message – Continuous value supplied to discrete scale
ggplot(iris, aes(x = Petal.Length, # Applying factor function group = Petal.Width.Groups, color = factor(Petal.Width.Groups))) + geom_boxplot() + scale_color_manual(values = c("red", "green", "blue")) |
ggplot(iris, aes(x = Petal.Length, # Applying factor function group = Petal.Width.Groups, color = factor(Petal.Width.Groups))) + geom_boxplot() + scale_color_manual(values = c("red", "green", "blue"))

Related Articles
Please find some further R programming tutorials on topics such as coding errors and ggplot2 in the following list:
