Draw Line Segment & Curve in ggplot2 Plot in R (2 Examples)
In this post, I’ll demonstrate how to add line segments and curves to ggplot2 graphs in the R programming language.
Preparing the Examples
data(iris) # Loa iris data set head(iris) # Sepal.Length Sepal.Width Petal.Length Petal.Width Species # 1 5.1 3.5 1.4 0.2 setosa # 2 4.9 3.0 1.4 0.2 setosa # 3 4.7 3.2 1.3 0.2 setosa # 4 4.6 3.1 1.5 0.2 setosa # 5 5.0 3.6 1.4 0.2 setosa # 6 5.4 3.9 1.7 0.4 setosa |
data(iris) # Loa iris data set head(iris) # Sepal.Length Sepal.Width Petal.Length Petal.Width Species # 1 5.1 3.5 1.4 0.2 setosa # 2 4.9 3.0 1.4 0.2 setosa # 3 4.7 3.2 1.3 0.2 setosa # 4 4.6 3.1 1.5 0.2 setosa # 5 5.0 3.6 1.4 0.2 setosa # 6 5.4 3.9 1.7 0.4 setosa
install.packages("ggplot2") # Install ggplot2 package library("ggplot2") # Load ggplot2 package |
install.packages("ggplot2") # Install ggplot2 package library("ggplot2") # Load ggplot2 package
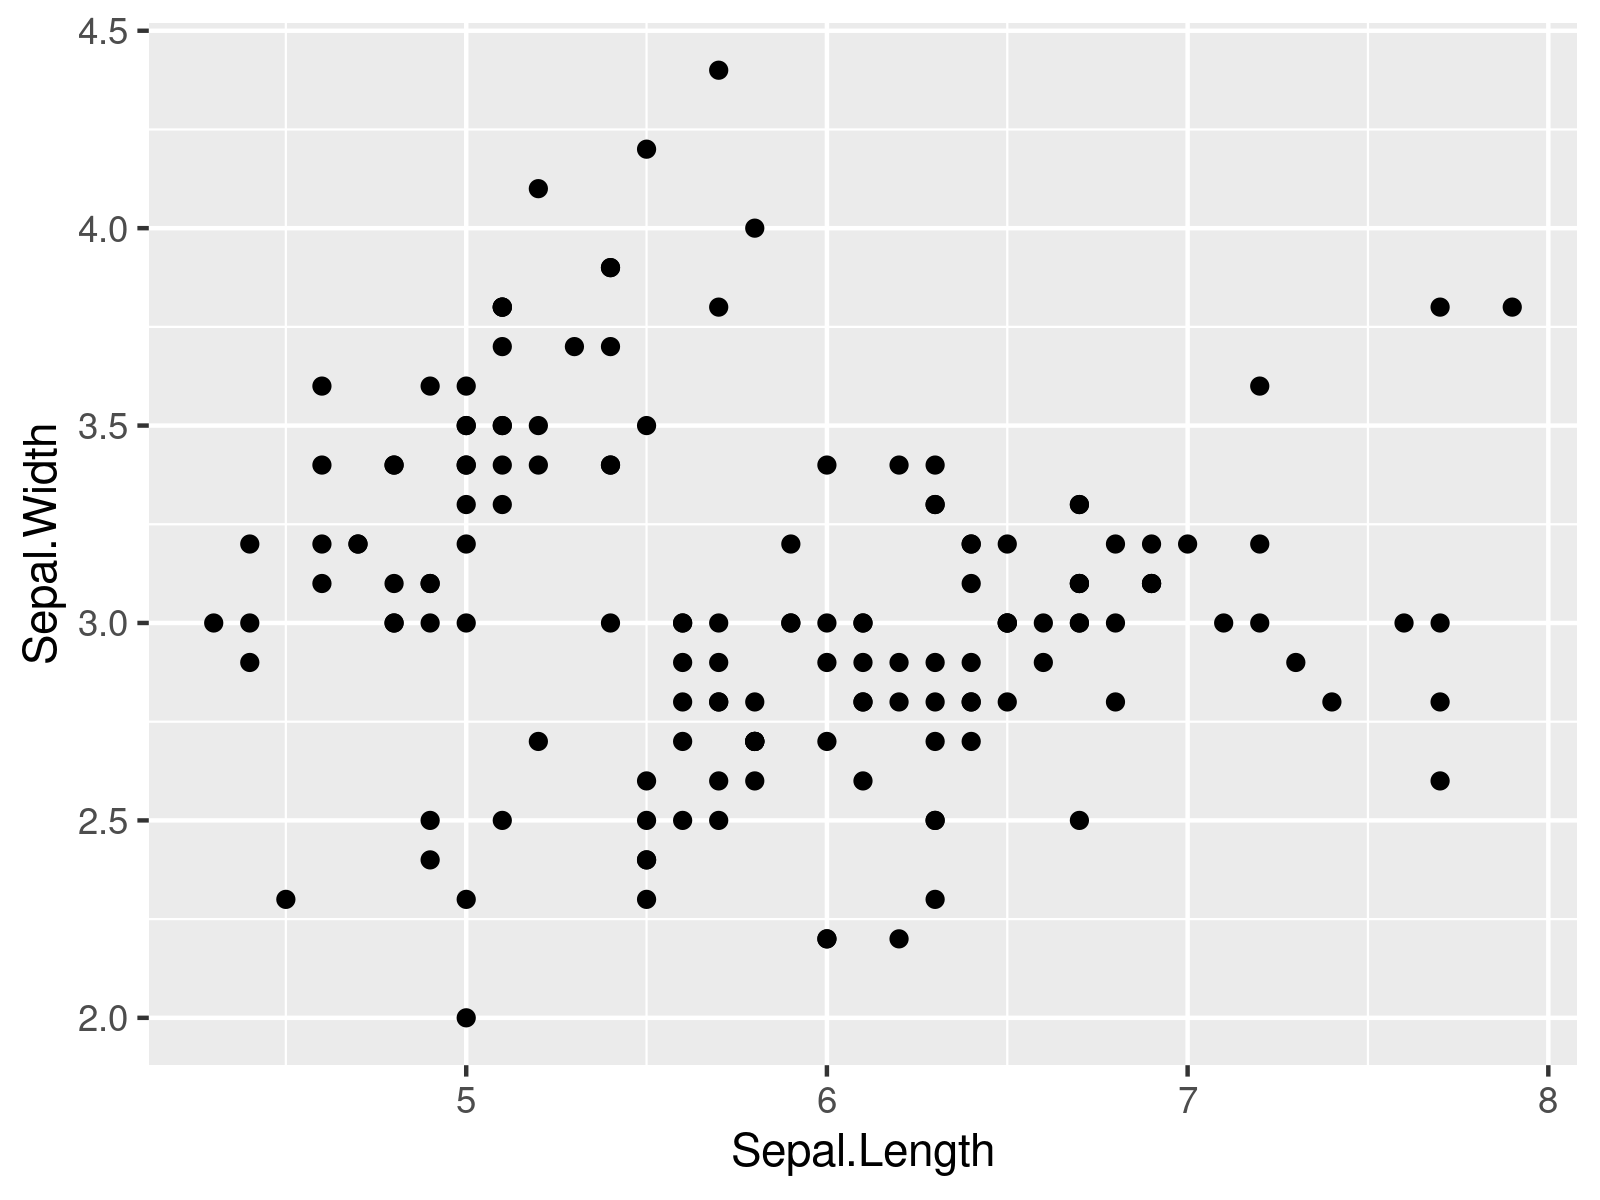
my_plot <- ggplot(iris, # ggplot2 scatterplot aes(x = Sepal.Length, y = Sepal.Width)) + geom_point() my_plot |
my_plot <- ggplot(iris, # ggplot2 scatterplot aes(x = Sepal.Length, y = Sepal.Width)) + geom_point() my_plot

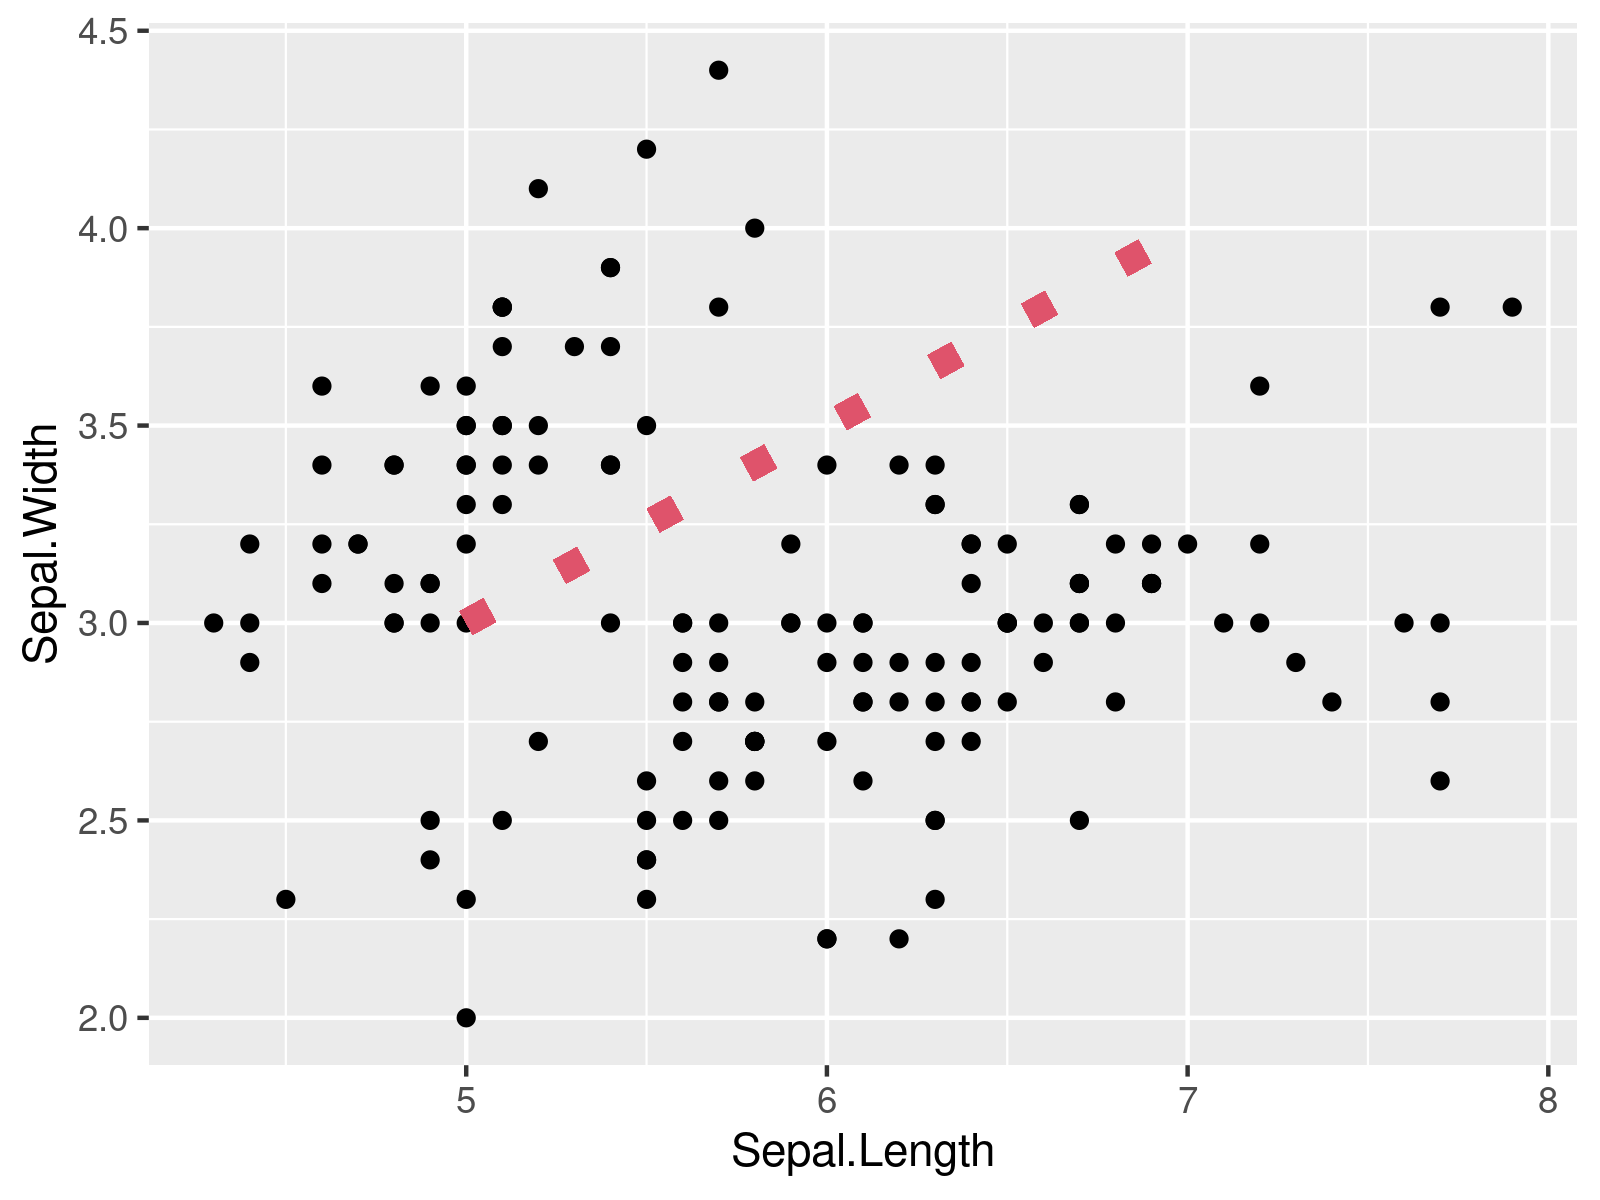
Example 1: Draw Line Segment in ggplot2 Plot Using geom_segment() Function
my_plot + # Modify color, size & linetype geom_segment(x = 5, y = 3, xend = 7, yend = 4, col = 2, size = 3, linetype = "dotted") |
my_plot + # Modify color, size & linetype geom_segment(x = 5, y = 3, xend = 7, yend = 4, col = 2, size = 3, linetype = "dotted")

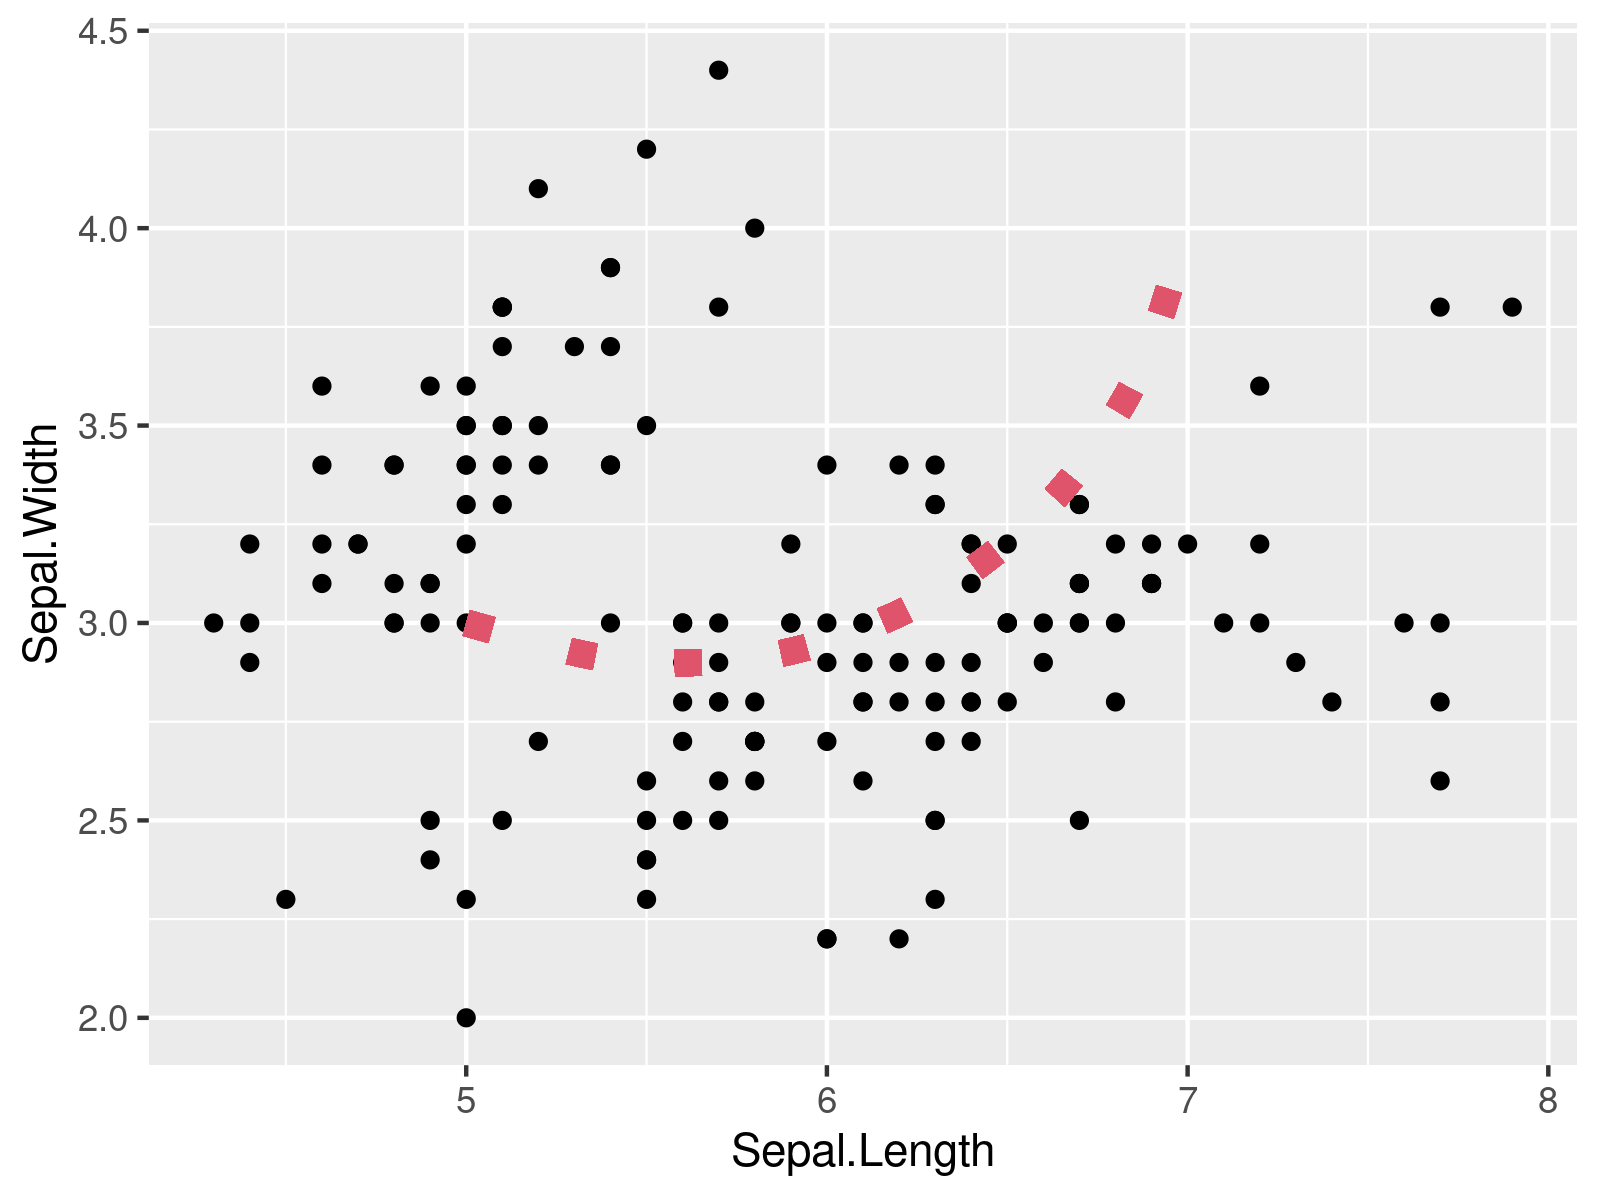
Example 2: Draw Curve in ggplot2 Plot Using geom_curve() Function
my_plot + # Modify color, size & linetype geom_curve(x = 5, y = 3, xend = 7, yend = 4, col = 2, size = 3, linetype = "dotted") |
my_plot + # Modify color, size & linetype geom_curve(x = 5, y = 3, xend = 7, yend = 4, col = 2, size = 3, linetype = "dotted")

Related Tutorials
Below, you may find some additional resources on topics such as lines, graphics in R, and regression models:
