R Plot Polynomial Regression Curve in ggplot2 (Example Code)
In this tutorial you’ll learn how to overlay a polynomial regression line to a graphic in R.
Preparing the Example
set.seed(1846284) # Construct example data x <- rnorm(800) y <- rnorm(800) + 0.1 * x^5 my_df <- data.frame(x, y) head(my_df) # x y # 1 1.23898915 -0.6280246 # 2 0.38140494 -1.5075838 # 3 -0.28617182 0.2278058 # 4 0.09752449 -0.2307440 # 5 -1.83669341 -2.2567640 # 6 0.84187498 -2.3804109 |
set.seed(1846284) # Construct example data x <- rnorm(800) y <- rnorm(800) + 0.1 * x^5 my_df <- data.frame(x, y) head(my_df) # x y # 1 1.23898915 -0.6280246 # 2 0.38140494 -1.5075838 # 3 -0.28617182 0.2278058 # 4 0.09752449 -0.2307440 # 5 -1.83669341 -2.2567640 # 6 0.84187498 -2.3804109
install.packages("ggplot2") # Install ggplot2 package library("ggplot2") # Load ggplot2 package |
install.packages("ggplot2") # Install ggplot2 package library("ggplot2") # Load ggplot2 package
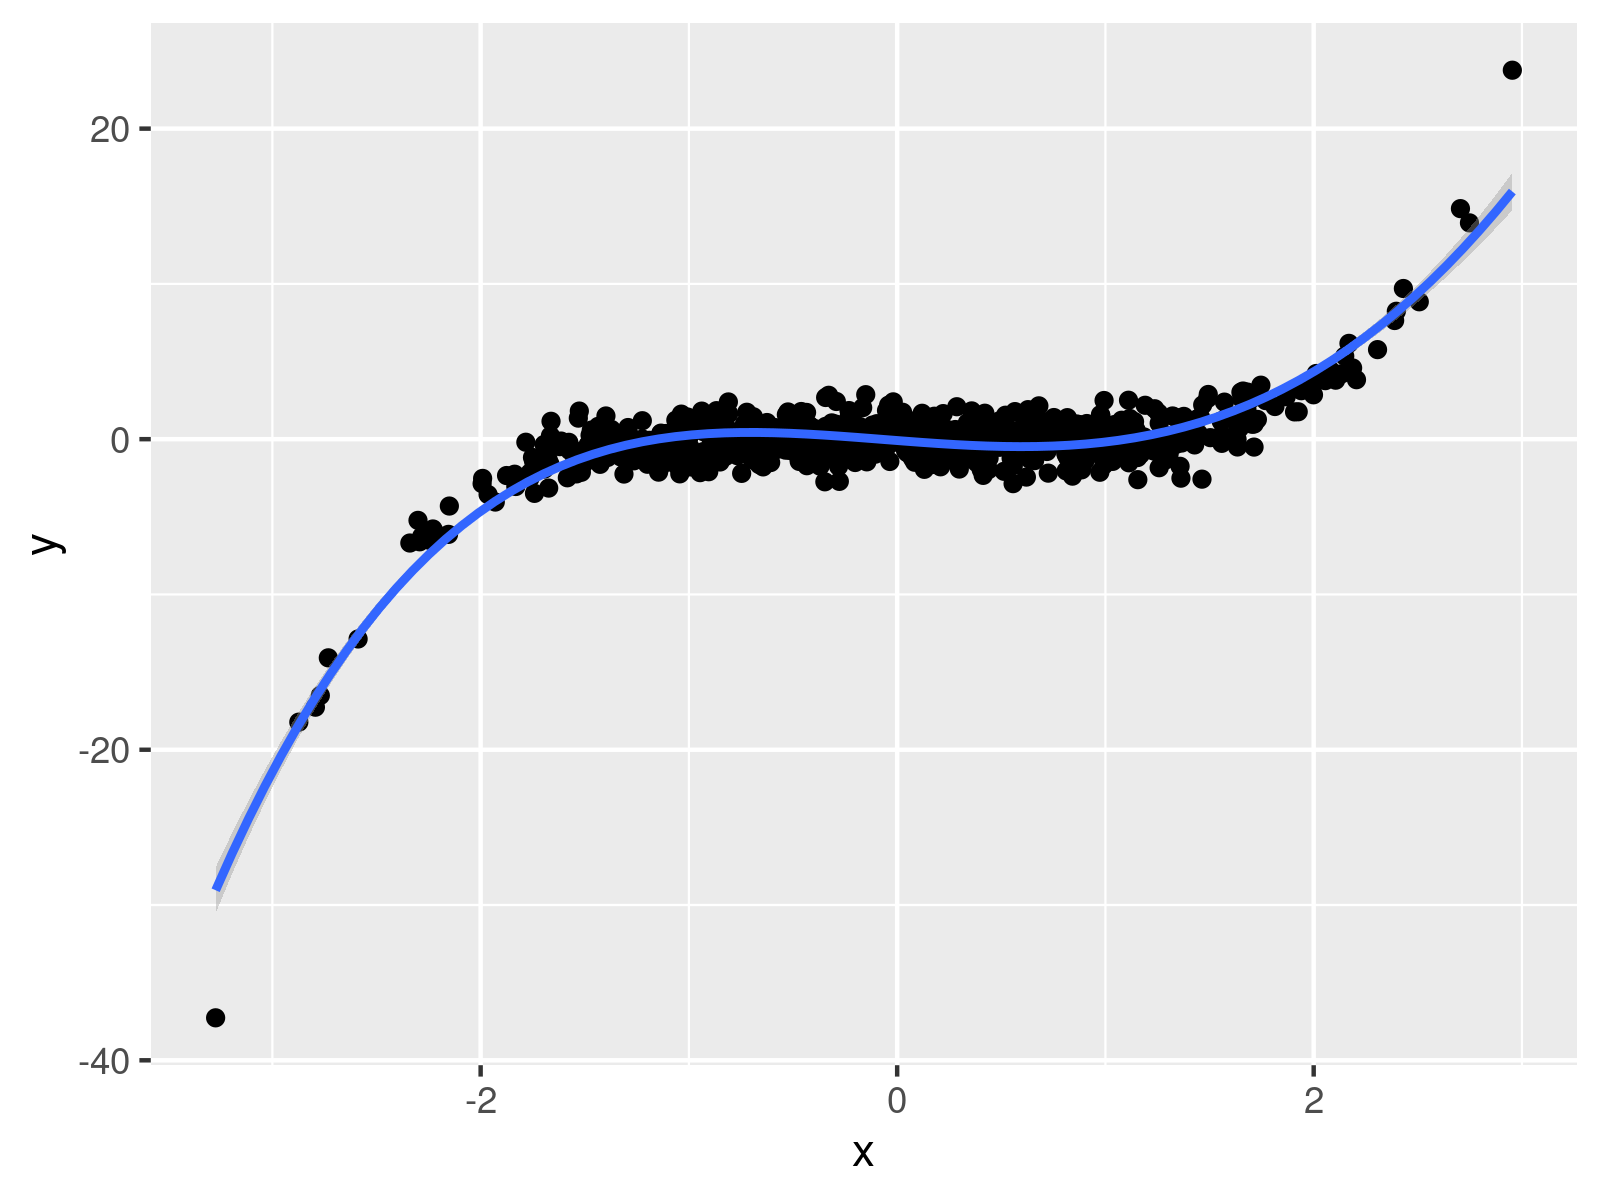
Example: Create ggplot2 Plot with Polynomial Regression Line
ggplot(my_df, aes(x = x, y = y)) + geom_point() + stat_smooth(method = "lm", formula = y ~ poly(x, 4)) |
ggplot(my_df, aes(x = x, y = y)) + geom_point() + stat_smooth(method = "lm", formula = y ~ poly(x, 4))

Related Tutorials & Further Resources
Have a look at the following R programming tutorials. They discuss topics such as graphics in R, plot legends, and ggplot2.
