Draw Labels with Subscript & Superscript in ggplot2 Facet Plot in R (Example Code)
In this R tutorial you’ll learn how to draw labels with subscripts and superscripts in a ggplot2 facet plot.
Preparing the Example
data(iris) # Loading data head(iris) # Sepal.Length Sepal.Width Petal.Length Petal.Width Species # 1 5.1 3.5 1.4 0.2 setosa # 2 4.9 3.0 1.4 0.2 setosa # 3 4.7 3.2 1.3 0.2 setosa # 4 4.6 3.1 1.5 0.2 setosa # 5 5.0 3.6 1.4 0.2 setosa # 6 5.4 3.9 1.7 0.4 setosa |
data(iris) # Loading data head(iris) # Sepal.Length Sepal.Width Petal.Length Petal.Width Species # 1 5.1 3.5 1.4 0.2 setosa # 2 4.9 3.0 1.4 0.2 setosa # 3 4.7 3.2 1.3 0.2 setosa # 4 4.6 3.1 1.5 0.2 setosa # 5 5.0 3.6 1.4 0.2 setosa # 6 5.4 3.9 1.7 0.4 setosa
install.packages("ggplot2") # Install & load ggplot2 package library("ggplot2") |
install.packages("ggplot2") # Install & load ggplot2 package library("ggplot2")
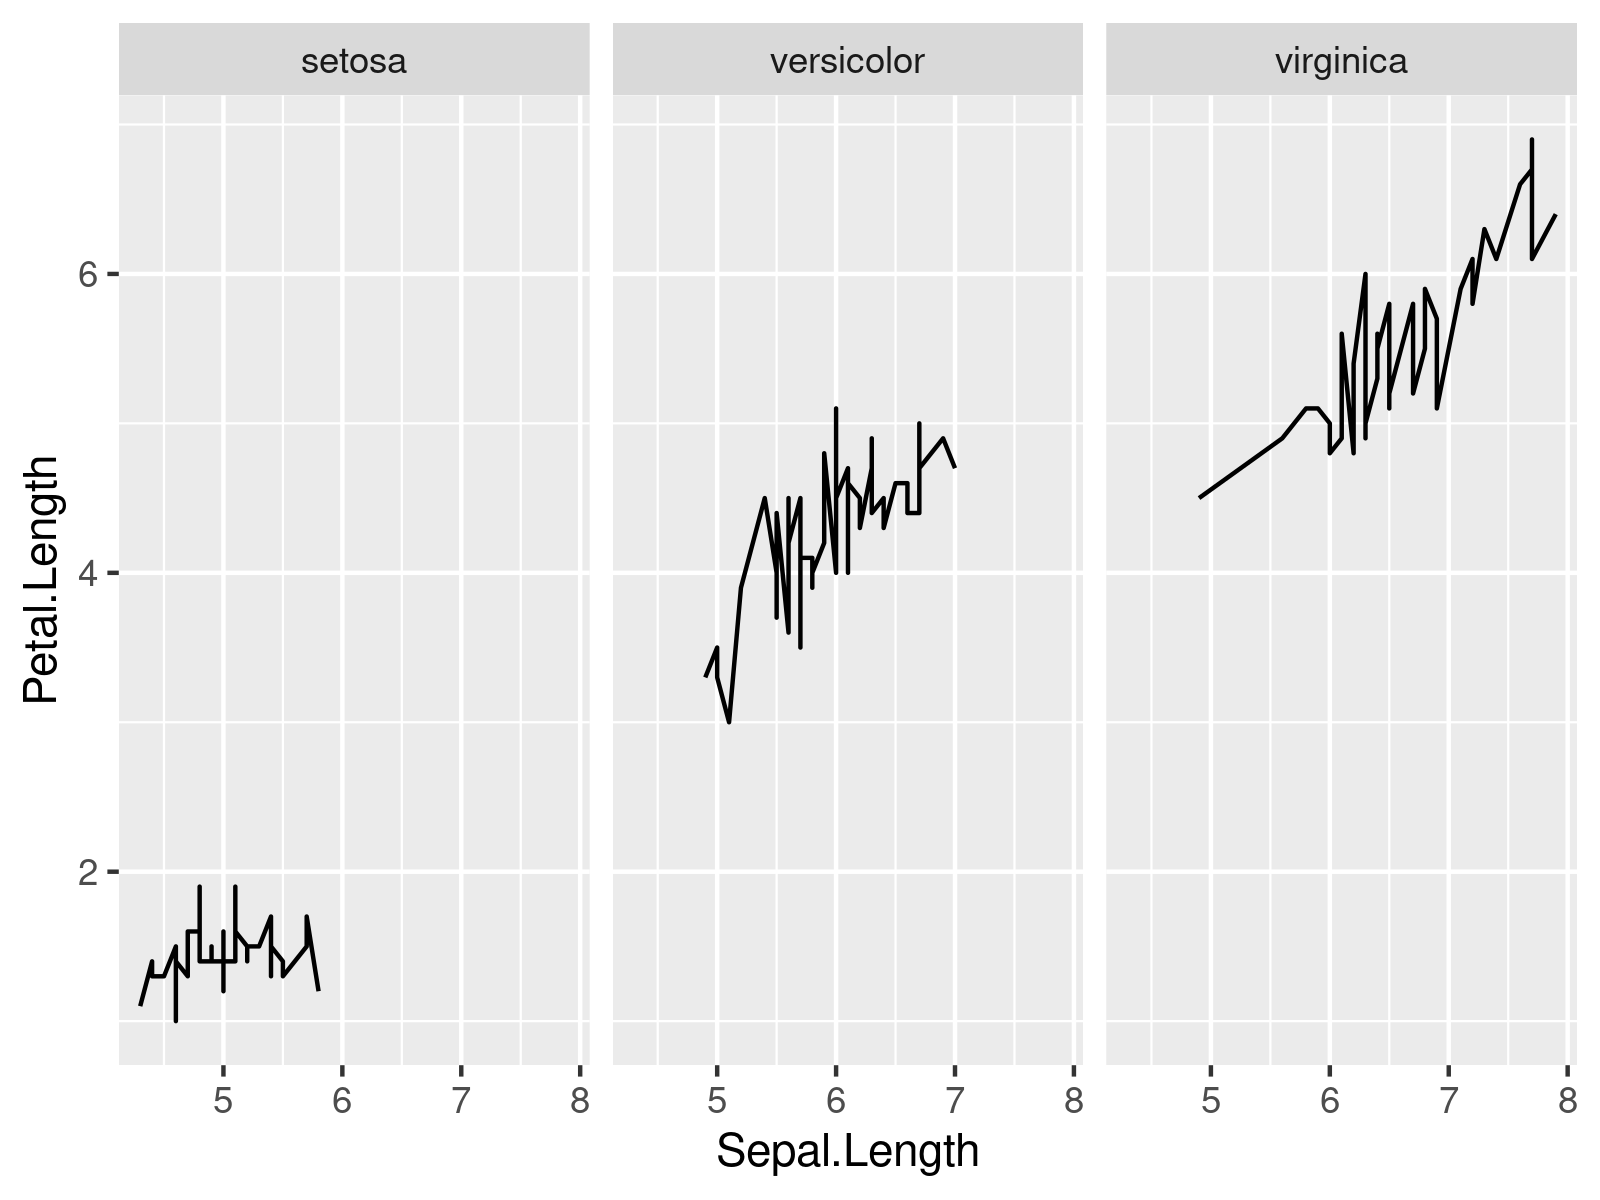
ggplot(iris, # Default facet plot labels aes(x = Sepal.Length, y = Petal.Length)) + geom_line() + facet_wrap(Species ~ .) |
ggplot(iris, # Default facet plot labels aes(x = Sepal.Length, y = Petal.Length)) + geom_line() + facet_wrap(Species ~ .)

Example: Draw ggplot2 Facet Plot with Subscripts & Superscripts in Labels
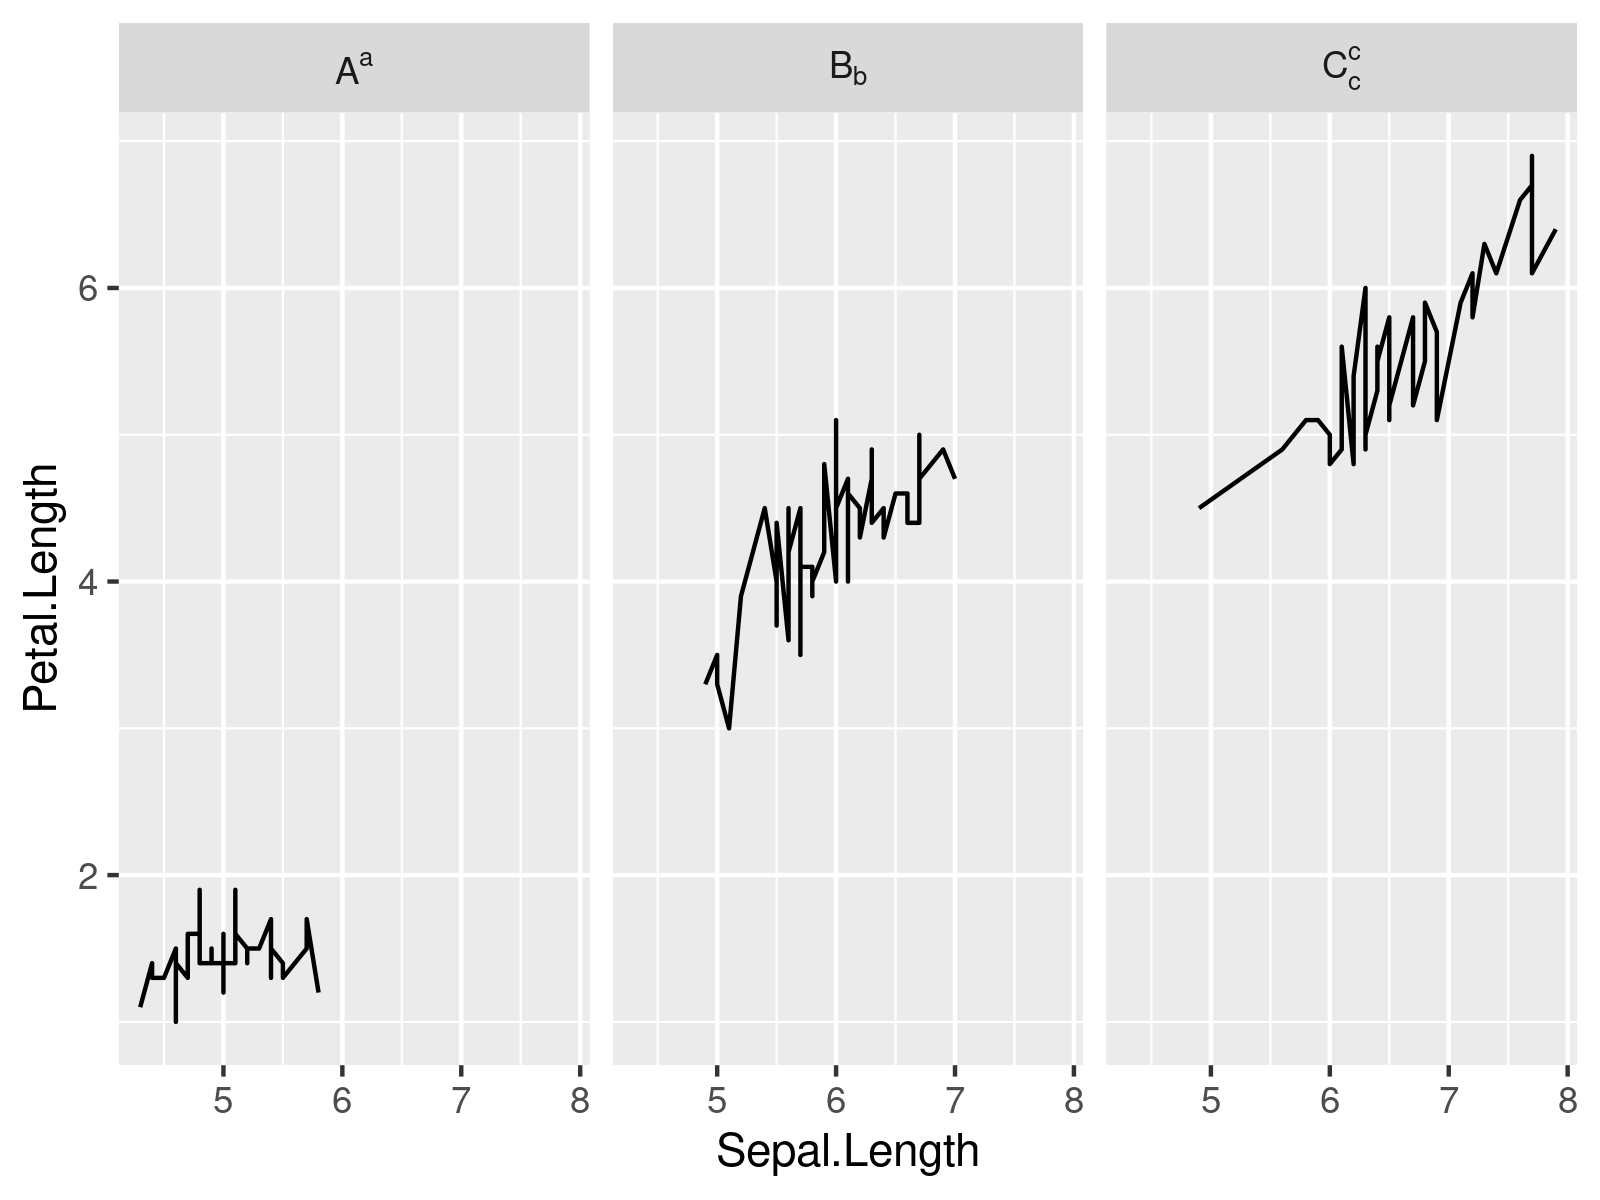
iris_mod <- iris # Modify labels iris_mod$Species <- factor(iris_mod$Species, labels = c("A^a", "B[b]", "C[c]^c")) |
iris_mod <- iris # Modify labels iris_mod$Species <- factor(iris_mod$Species, labels = c("A^a", "B[b]", "C[c]^c"))
ggplot(iris_mod, # Subscript & superscript labels aes(x = Sepal.Length, y = Petal.Length)) + geom_line() + facet_wrap(Species ~ ., labeller = label_parsed) |
ggplot(iris_mod, # Subscript & superscript labels aes(x = Sepal.Length, y = Petal.Length)) + geom_line() + facet_wrap(Species ~ ., labeller = label_parsed)

Further Resources & Related Articles
In the following, you may find some additional resources on topics such as graphics in R, ggplot2, and labels:
