Create Heatmap-Like Plot of Categorical Data in R (Example Code)
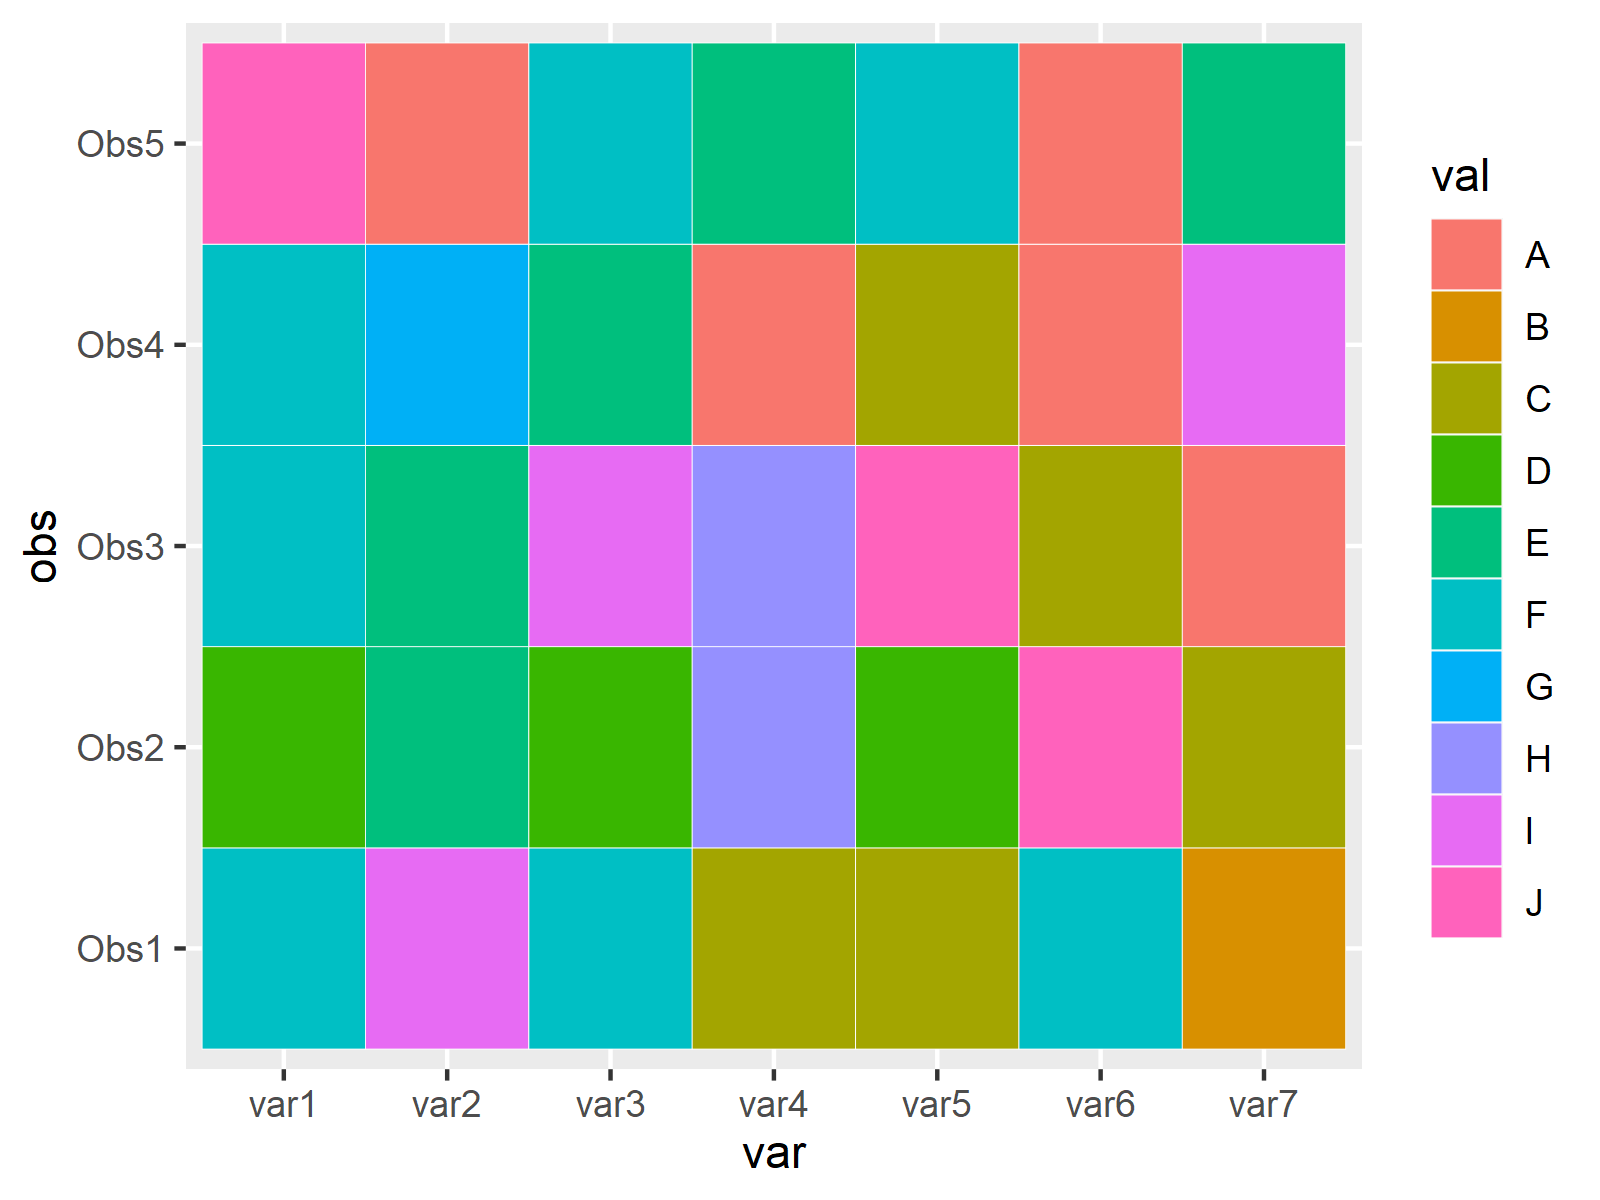
In this R programming tutorial you’ll learn how to create a heatmap-like graphic of categorical data.
Creation of Exemplifying Data
set.seed(58323214) # Set random seed df <- data.frame(obs = rep(paste0("Obs", 1:5), each = 7), # Constructing example data frame var = paste0("var", 1:7), val = sample(LETTERS[1:10], 5 * 7, replace = TRUE)) df # obs var val # 1 Obs1 var1 F # 2 Obs1 var2 I # 3 Obs1 var3 F # 4 Obs1 var4 C # 5 Obs1 var5 C # 6 Obs1 var6 F # 7 Obs1 var7 B # 8 Obs2 var1 D # 9 Obs2 var2 E # 10 Obs2 var3 D # 11 Obs2 var4 H # 12 Obs2 var5 D # 13 Obs2 var6 J # 14 Obs2 var7 C # 15 Obs3 var1 F # 16 Obs3 var2 E # 17 Obs3 var3 I # 18 Obs3 var4 H # 19 Obs3 var5 J # 20 Obs3 var6 C # 21 Obs3 var7 A # 22 Obs4 var1 F # 23 Obs4 var2 G # 24 Obs4 var3 E # 25 Obs4 var4 A # 26 Obs4 var5 C # 27 Obs4 var6 A # 28 Obs4 var7 I # 29 Obs5 var1 J # 30 Obs5 var2 A # 31 Obs5 var3 F # 32 Obs5 var4 E # 33 Obs5 var5 F # 34 Obs5 var6 A # 35 Obs5 var7 E |
set.seed(58323214) # Set random seed df <- data.frame(obs = rep(paste0("Obs", 1:5), each = 7), # Constructing example data frame var = paste0("var", 1:7), val = sample(LETTERS[1:10], 5 * 7, replace = TRUE)) df # obs var val # 1 Obs1 var1 F # 2 Obs1 var2 I # 3 Obs1 var3 F # 4 Obs1 var4 C # 5 Obs1 var5 C # 6 Obs1 var6 F # 7 Obs1 var7 B # 8 Obs2 var1 D # 9 Obs2 var2 E # 10 Obs2 var3 D # 11 Obs2 var4 H # 12 Obs2 var5 D # 13 Obs2 var6 J # 14 Obs2 var7 C # 15 Obs3 var1 F # 16 Obs3 var2 E # 17 Obs3 var3 I # 18 Obs3 var4 H # 19 Obs3 var5 J # 20 Obs3 var6 C # 21 Obs3 var7 A # 22 Obs4 var1 F # 23 Obs4 var2 G # 24 Obs4 var3 E # 25 Obs4 var4 A # 26 Obs4 var5 C # 27 Obs4 var6 A # 28 Obs4 var7 I # 29 Obs5 var1 J # 30 Obs5 var2 A # 31 Obs5 var3 F # 32 Obs5 var4 E # 33 Obs5 var5 F # 34 Obs5 var6 A # 35 Obs5 var7 E
Example: Drawing a Similar Plot to a Heatmap Using geom_tile() of ggplot2 Package
install.packages("ggplot2") # Install & load ggplot2 library("ggplot2") |
install.packages("ggplot2") # Install & load ggplot2 library("ggplot2")
ggplot(df, # Creating a heatmap-like graphic aes(var, obs, fill = val)) + geom_tile(col = "white") |
ggplot(df, # Creating a heatmap-like graphic aes(var, obs, fill = val)) + geom_tile(col = "white")

Related Tutorials
Below, you may find some additional resources that are related to the topic of this page:
