Replace Numbers of Continuous ggplot2 Legend by Text in R (Example Code)
In this R tutorial you’ll learn how to replace the values of a continuous ggplot2 legend by text.
Preparing the Example
set.seed(289367) # Example data my_df <- data.frame(expand.grid(x = 0:5, y = 0:5), z = rnorm(36)) head(my_df) # x y z # 1 0 0 -1.75255286 # 2 1 0 -0.22511947 # 3 2 0 1.00520336 # 4 3 0 1.23412700 # 5 4 0 -0.05995937 # 6 5 0 -1.11686047 |
set.seed(289367) # Example data my_df <- data.frame(expand.grid(x = 0:5, y = 0:5), z = rnorm(36)) head(my_df) # x y z # 1 0 0 -1.75255286 # 2 1 0 -0.22511947 # 3 2 0 1.00520336 # 4 3 0 1.23412700 # 5 4 0 -0.05995937 # 6 5 0 -1.11686047
install.packages("ggplot2") # Install ggplot2 package library("ggplot2") # Load ggplot2 |
install.packages("ggplot2") # Install ggplot2 package library("ggplot2") # Load ggplot2
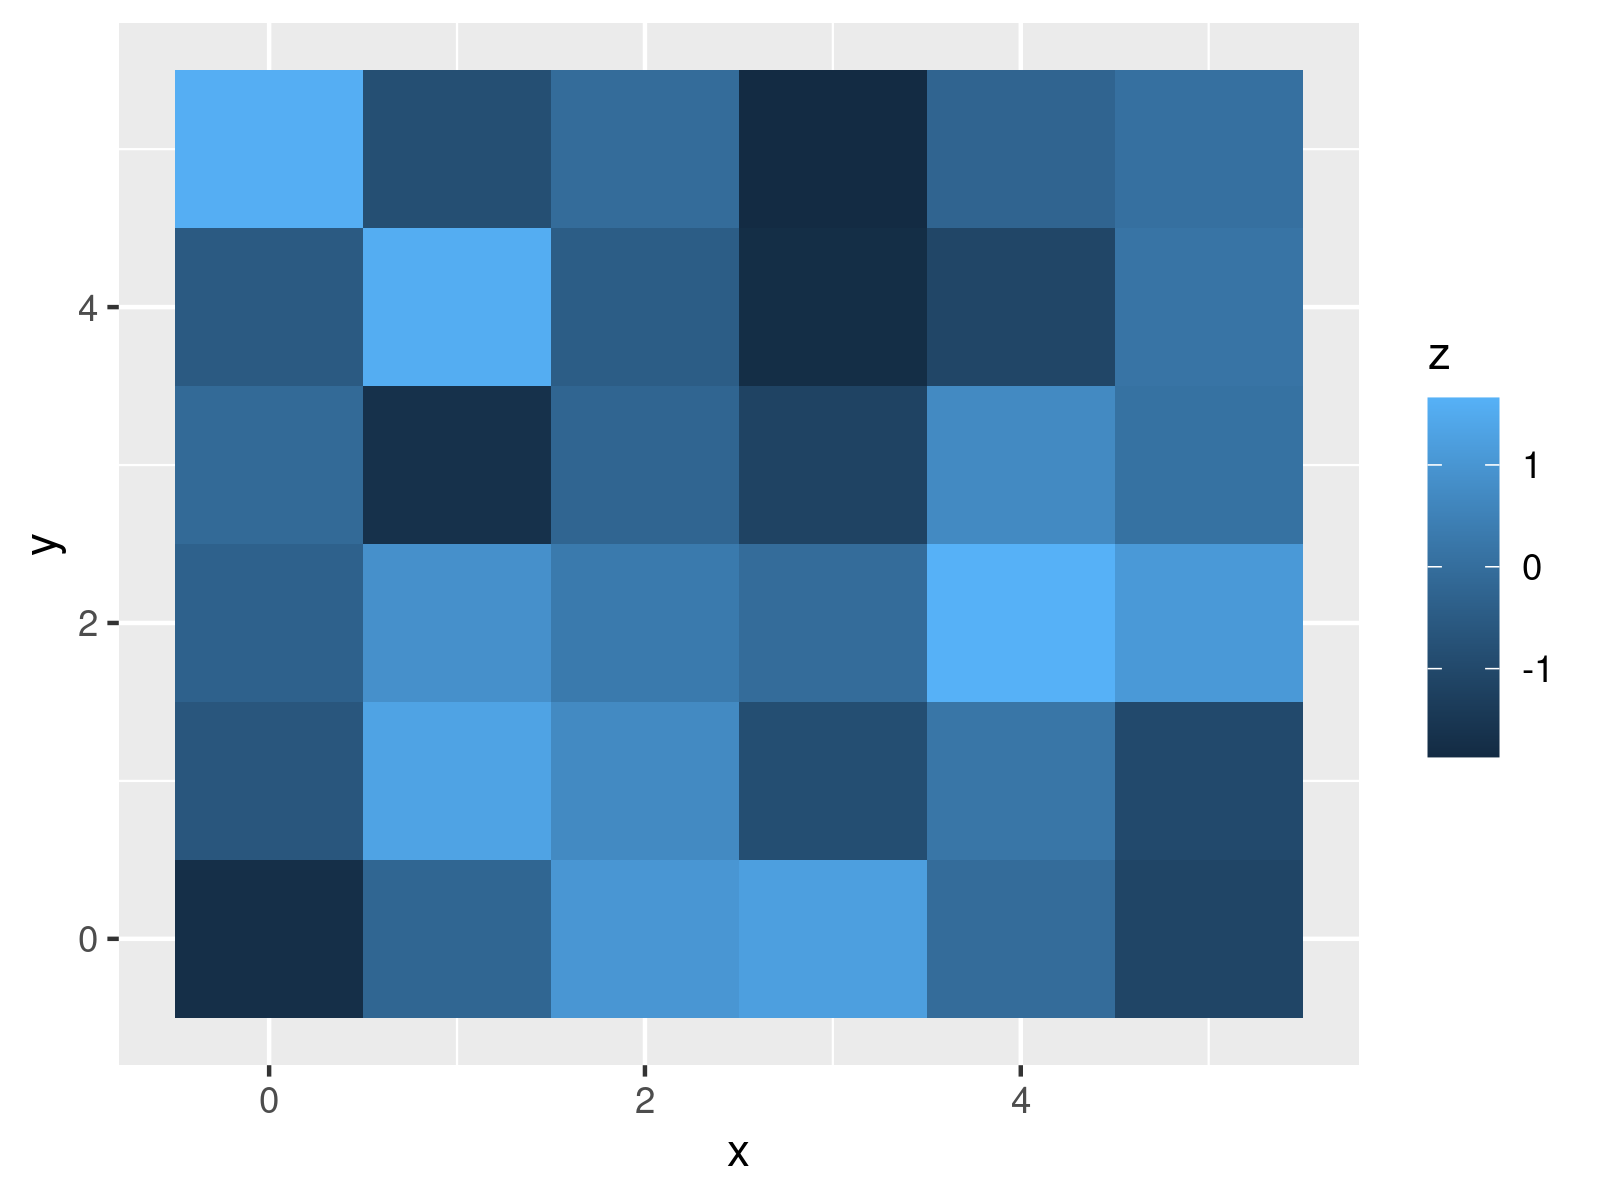
my_plot <- ggplot(my_df, aes(x, y, fill = z)) + # ggplot2 plot with default legend geom_tile() my_plot |
my_plot <- ggplot(my_df, aes(x, y, fill = z)) + # ggplot2 plot with default legend geom_tile() my_plot

Example: Label Minimum & Maximum of ggplot2 Legend Using scale_fill_gradientn() Function
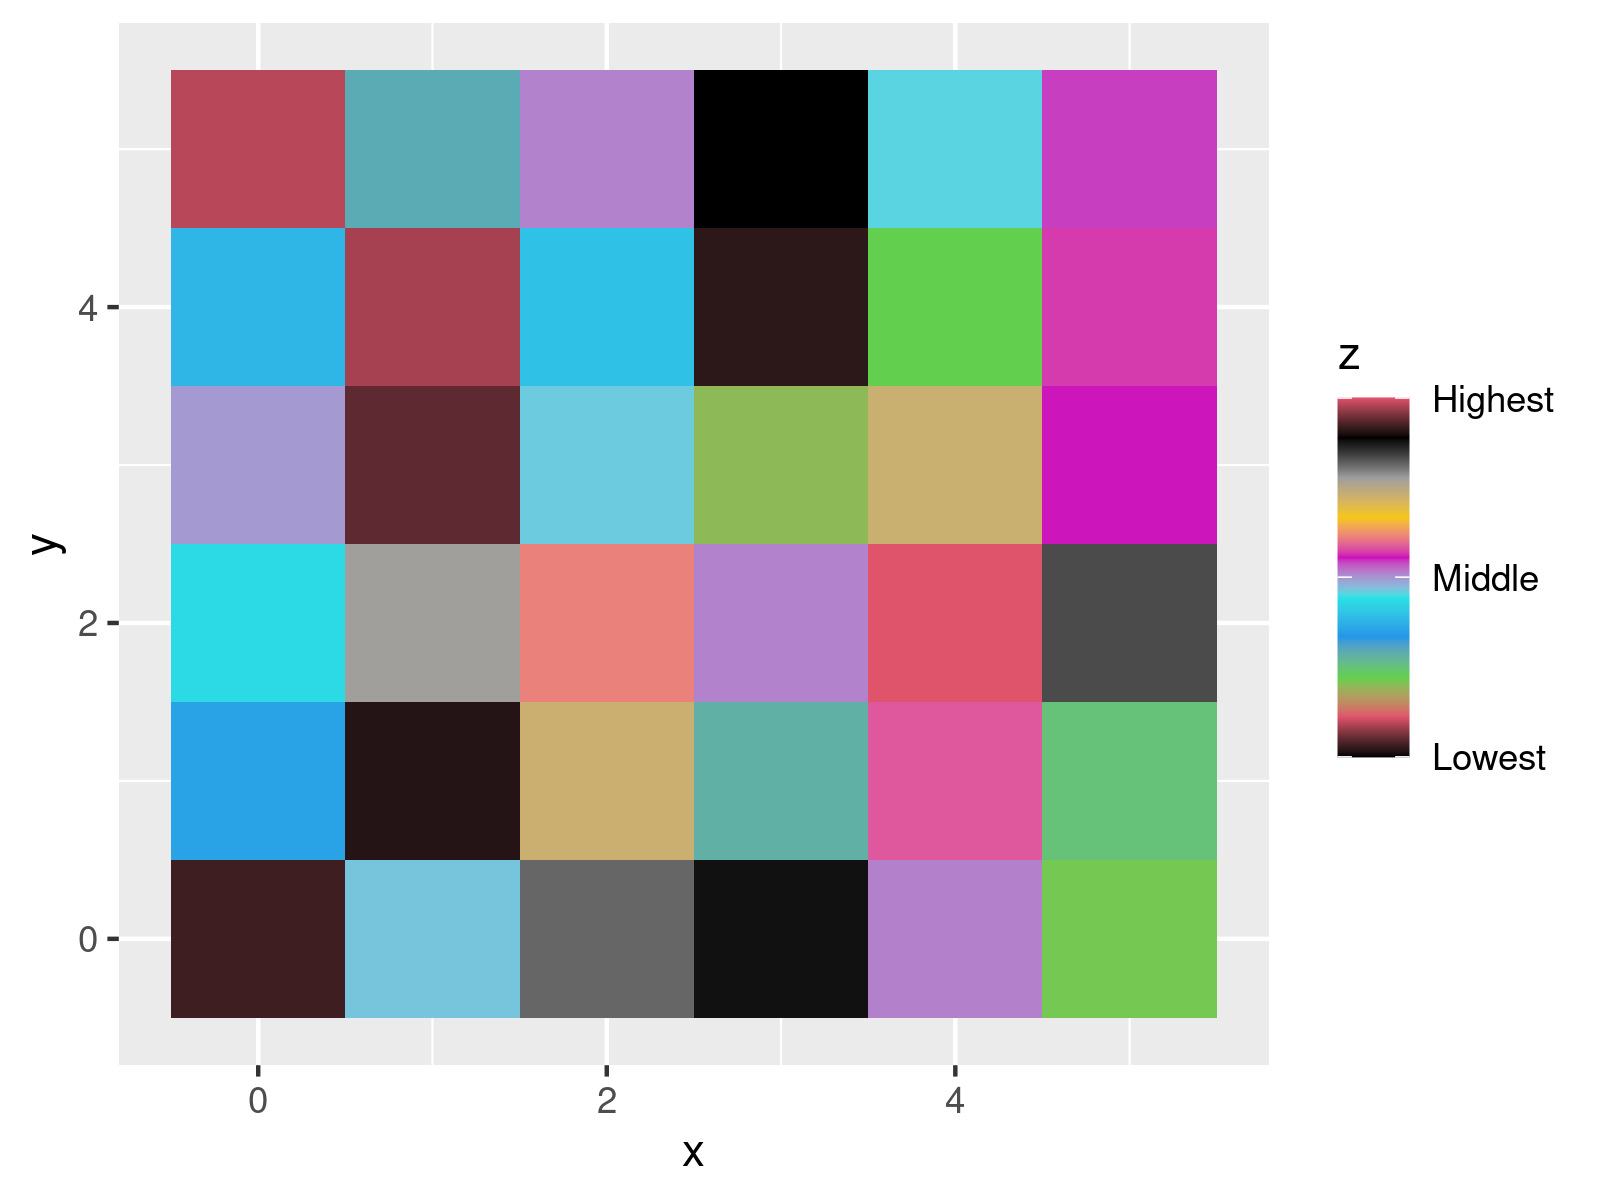
my_plot + # Change numbers in ggplot2 legend scale_fill_gradientn(colors = 1:10, breaks = c(min(my_df$z), mean(my_df$z), max(my_df$z)), labels = c("Lowest", "Middle", "Highest")) |
my_plot + # Change numbers in ggplot2 legend scale_fill_gradientn(colors = 1:10, breaks = c(min(my_df$z), mean(my_df$z), max(my_df$z)), labels = c("Lowest", "Middle", "Highest"))

Further Resources
You may find some related R tutorials on topics such as ggplot2, plot legends, and labels in the following list:
