R Warning Message – Removed rows containing non-finite values (stat_bin) (2 Examples)
In this tutorial, I’ll explain how to deal with the “Warning message: Removed X rows containing non-finite values (stat_bin)” in the R programming language.
Preparing the Examples
data(iris) # Example data head(iris) # Sepal.Length Sepal.Width Petal.Length Petal.Width Species # 1 5.1 3.5 1.4 0.2 setosa # 2 4.9 3.0 1.4 0.2 setosa # 3 4.7 3.2 1.3 0.2 setosa # 4 4.6 3.1 1.5 0.2 setosa # 5 5.0 3.6 1.4 0.2 setosa # 6 5.4 3.9 1.7 0.4 setosa |
data(iris) # Example data head(iris) # Sepal.Length Sepal.Width Petal.Length Petal.Width Species # 1 5.1 3.5 1.4 0.2 setosa # 2 4.9 3.0 1.4 0.2 setosa # 3 4.7 3.2 1.3 0.2 setosa # 4 4.6 3.1 1.5 0.2 setosa # 5 5.0 3.6 1.4 0.2 setosa # 6 5.4 3.9 1.7 0.4 setosa
install.packages("ggplot2") # Install & load ggplot2 library("ggplot2") |
install.packages("ggplot2") # Install & load ggplot2 library("ggplot2")
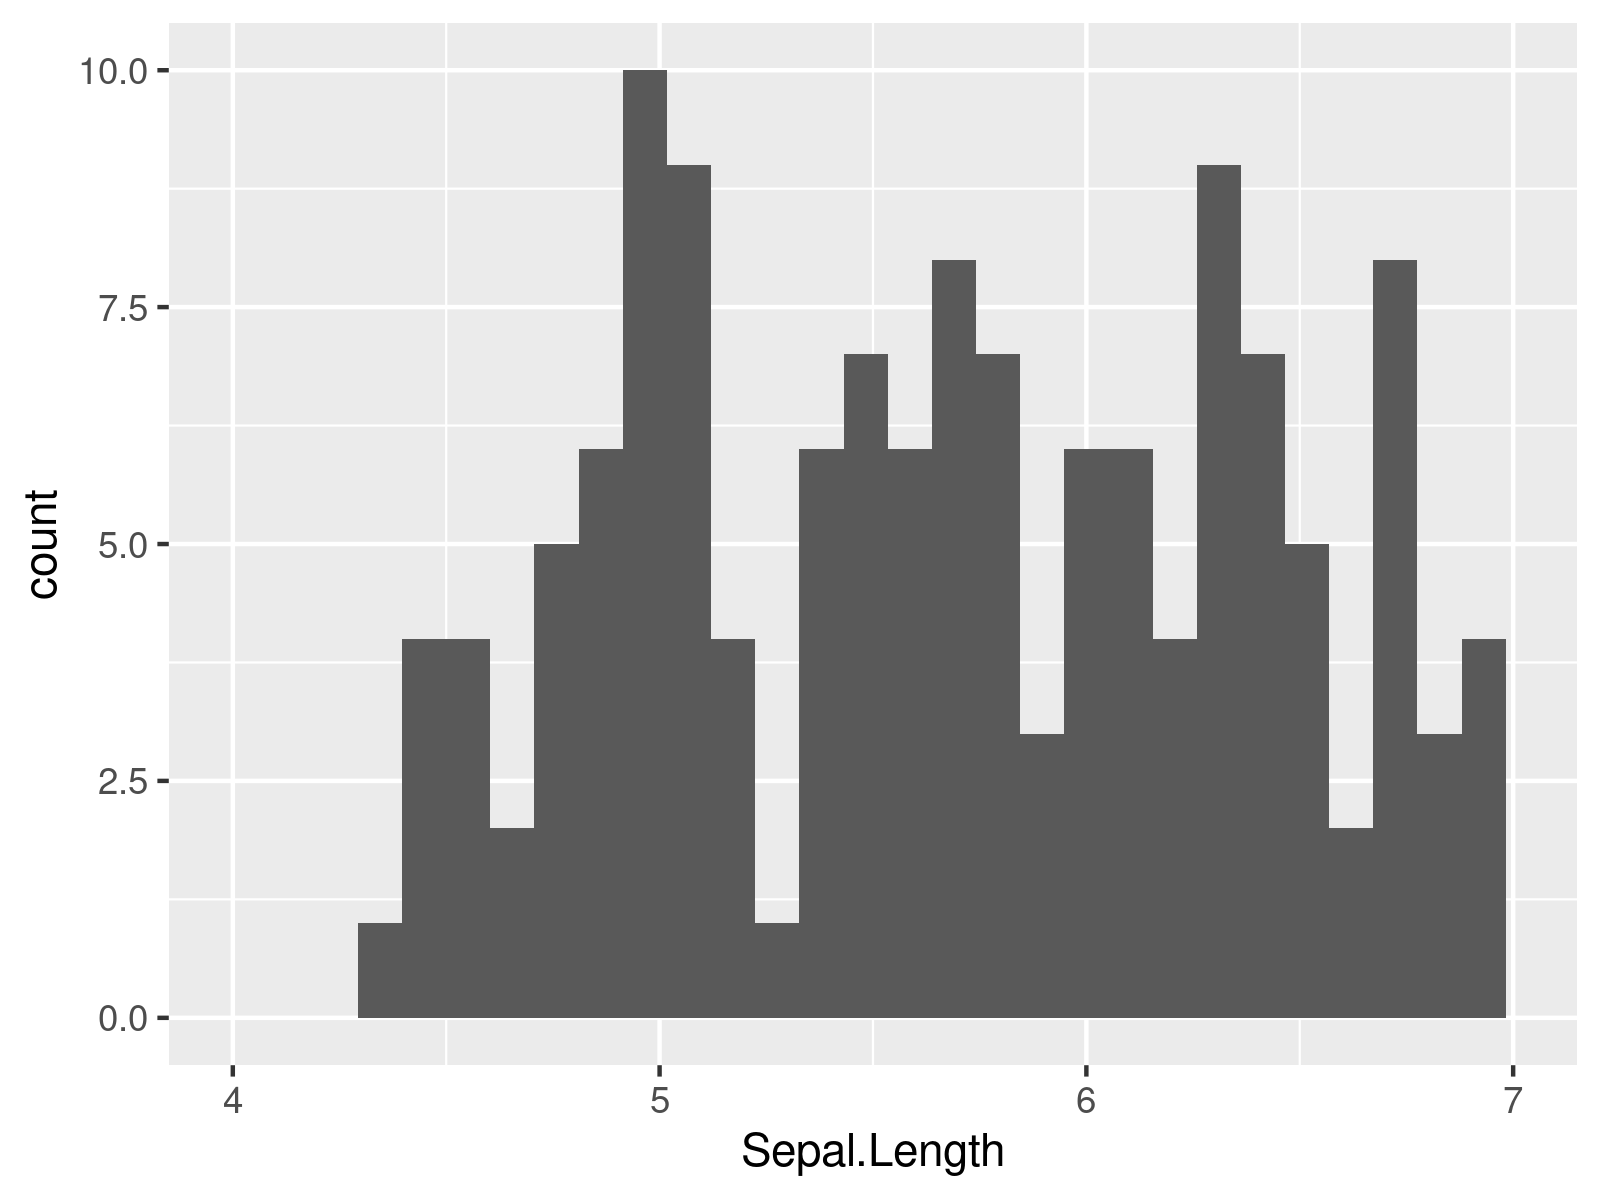
Example 1: Replicating the Warning – Removed X rows containing non-finite values (stat_bin)
ggplot(iris, # Specifying xlim leads to warning aes(x = Sepal.Length)) + geom_histogram() + xlim(4, 7) # Warning messages: # 1: Removed 12 rows containing non-finite values (stat_bin). # 2: Removed 2 rows containing missing values (geom_bar). |
ggplot(iris, # Specifying xlim leads to warning aes(x = Sepal.Length)) + geom_histogram() + xlim(4, 7) # Warning messages: # 1: Removed 12 rows containing non-finite values (stat_bin). # 2: Removed 2 rows containing missing values (geom_bar).

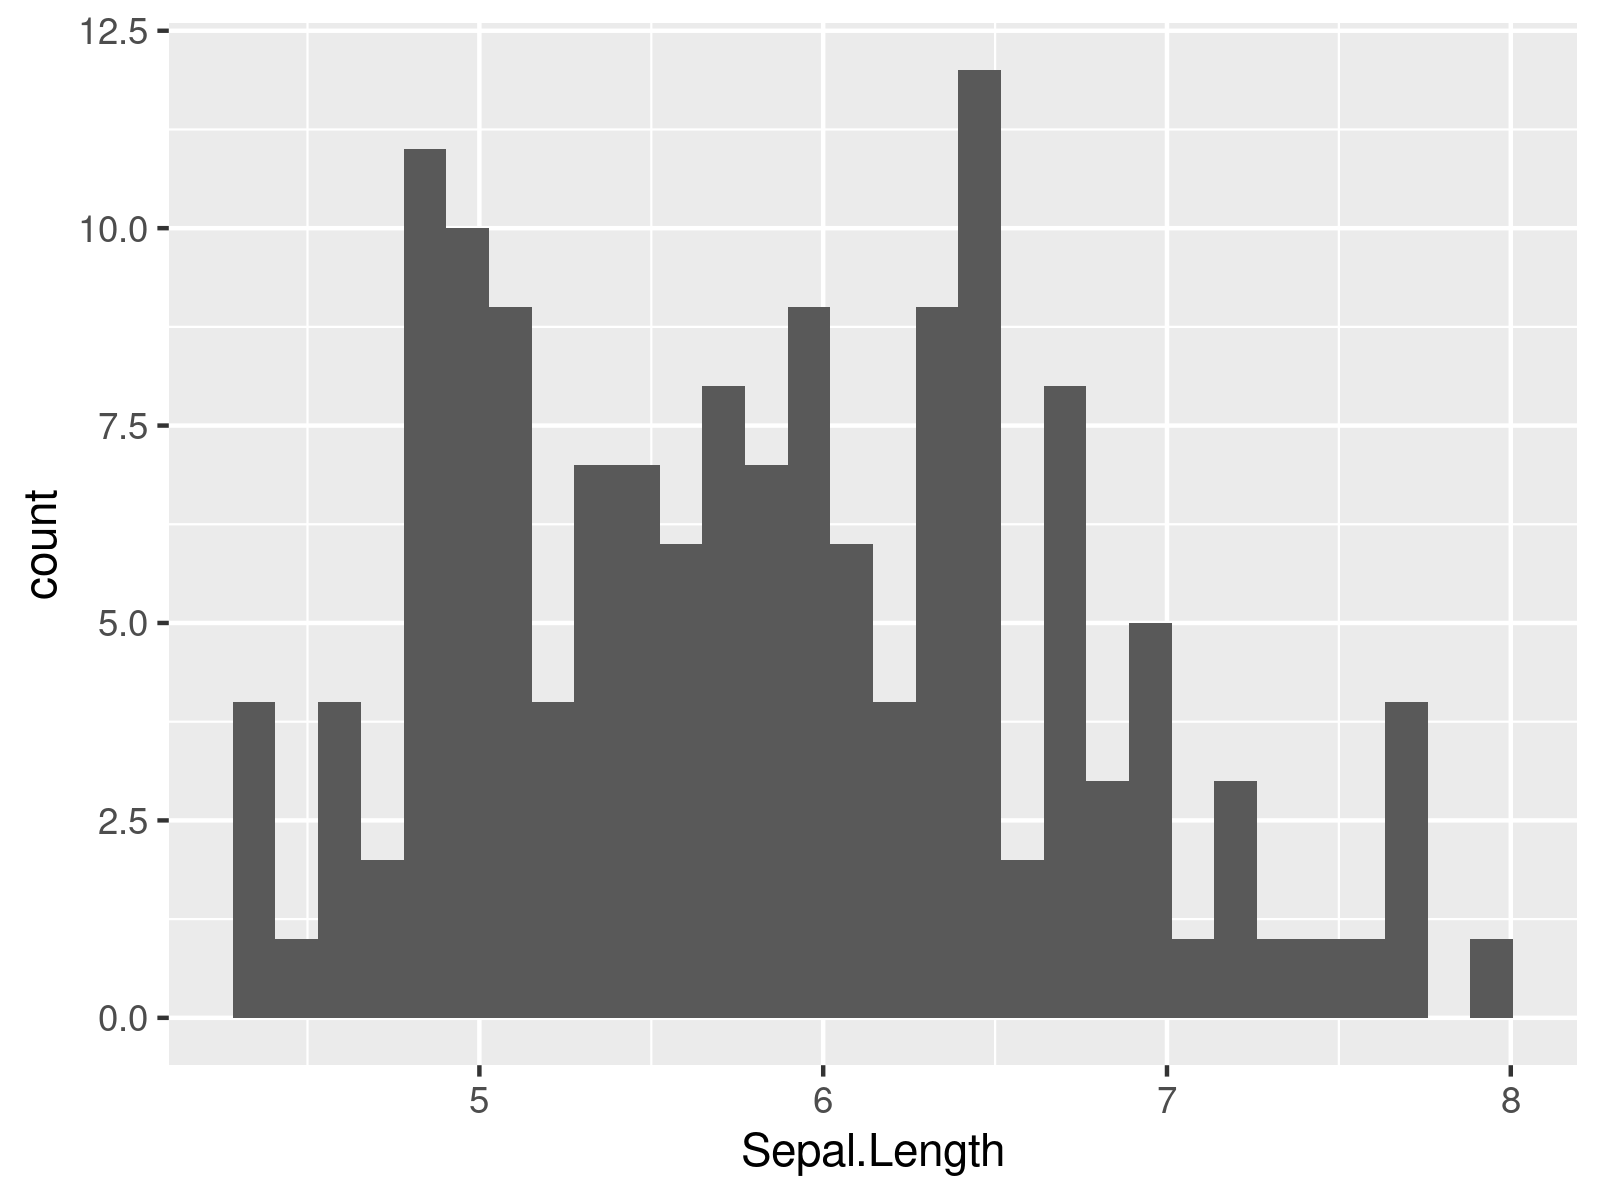
Example 2: Fixing the Warning – Removed X rows containing non-finite values (stat_bin)
ggplot(iris, # Do not specify xlim function aes(x = Sepal.Length)) + # Draw ggplot plot with manual xlim geom_histogram() |
ggplot(iris, # Do not specify xlim function aes(x = Sepal.Length)) + # Draw ggplot plot with manual xlim geom_histogram()

Related Tutorials
Please have a look at the following R programming language tutorials. They discuss topics such as ggplot2, extracting data, and missing data.
