ggplot2 Warning in R: Removed rows containing missing values (Example Code)
This page illustrates how to deal with the warning “Removed X rows containing missing values” in the R programming language.
Preparing the Example
data(iris) # Example data head(iris) # Sepal.Length Sepal.Width Petal.Length Petal.Width Species # 1 5.1 3.5 1.4 0.2 setosa # 2 4.9 3.0 1.4 0.2 setosa # 3 4.7 3.2 1.3 0.2 setosa # 4 4.6 3.1 1.5 0.2 setosa # 5 5.0 3.6 1.4 0.2 setosa # 6 5.4 3.9 1.7 0.4 setosa |
data(iris) # Example data head(iris) # Sepal.Length Sepal.Width Petal.Length Petal.Width Species # 1 5.1 3.5 1.4 0.2 setosa # 2 4.9 3.0 1.4 0.2 setosa # 3 4.7 3.2 1.3 0.2 setosa # 4 4.6 3.1 1.5 0.2 setosa # 5 5.0 3.6 1.4 0.2 setosa # 6 5.4 3.9 1.7 0.4 setosa
install.packages("ggplot2") # Install & load ggplot2 package library("ggplot2") |
install.packages("ggplot2") # Install & load ggplot2 package library("ggplot2")
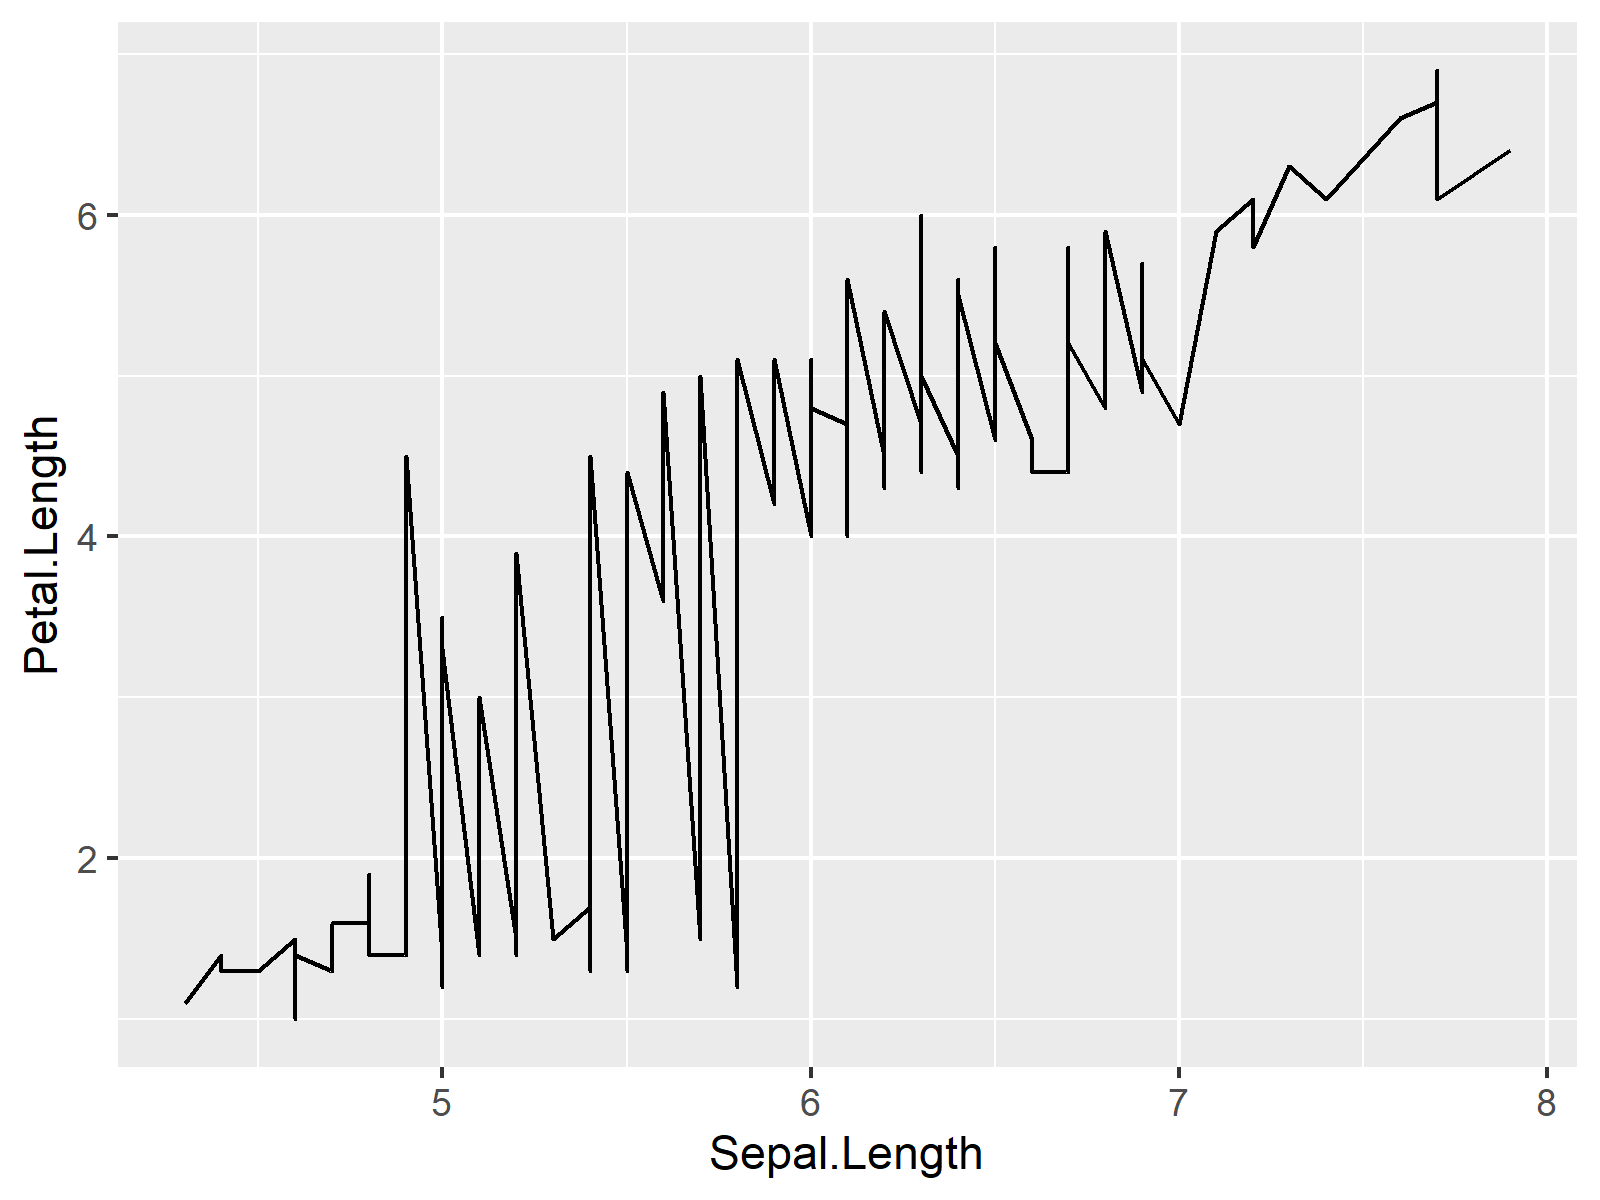
my_plot <- ggplot(iris, # Draw ggplot2 with default axes aes(Sepal.Length, Petal.Length)) + geom_line() my_plot |
my_plot <- ggplot(iris, # Draw ggplot2 with default axes aes(Sepal.Length, Petal.Length)) + geom_line() my_plot

Example: Replicate Warning – Removed X rows containing missing values
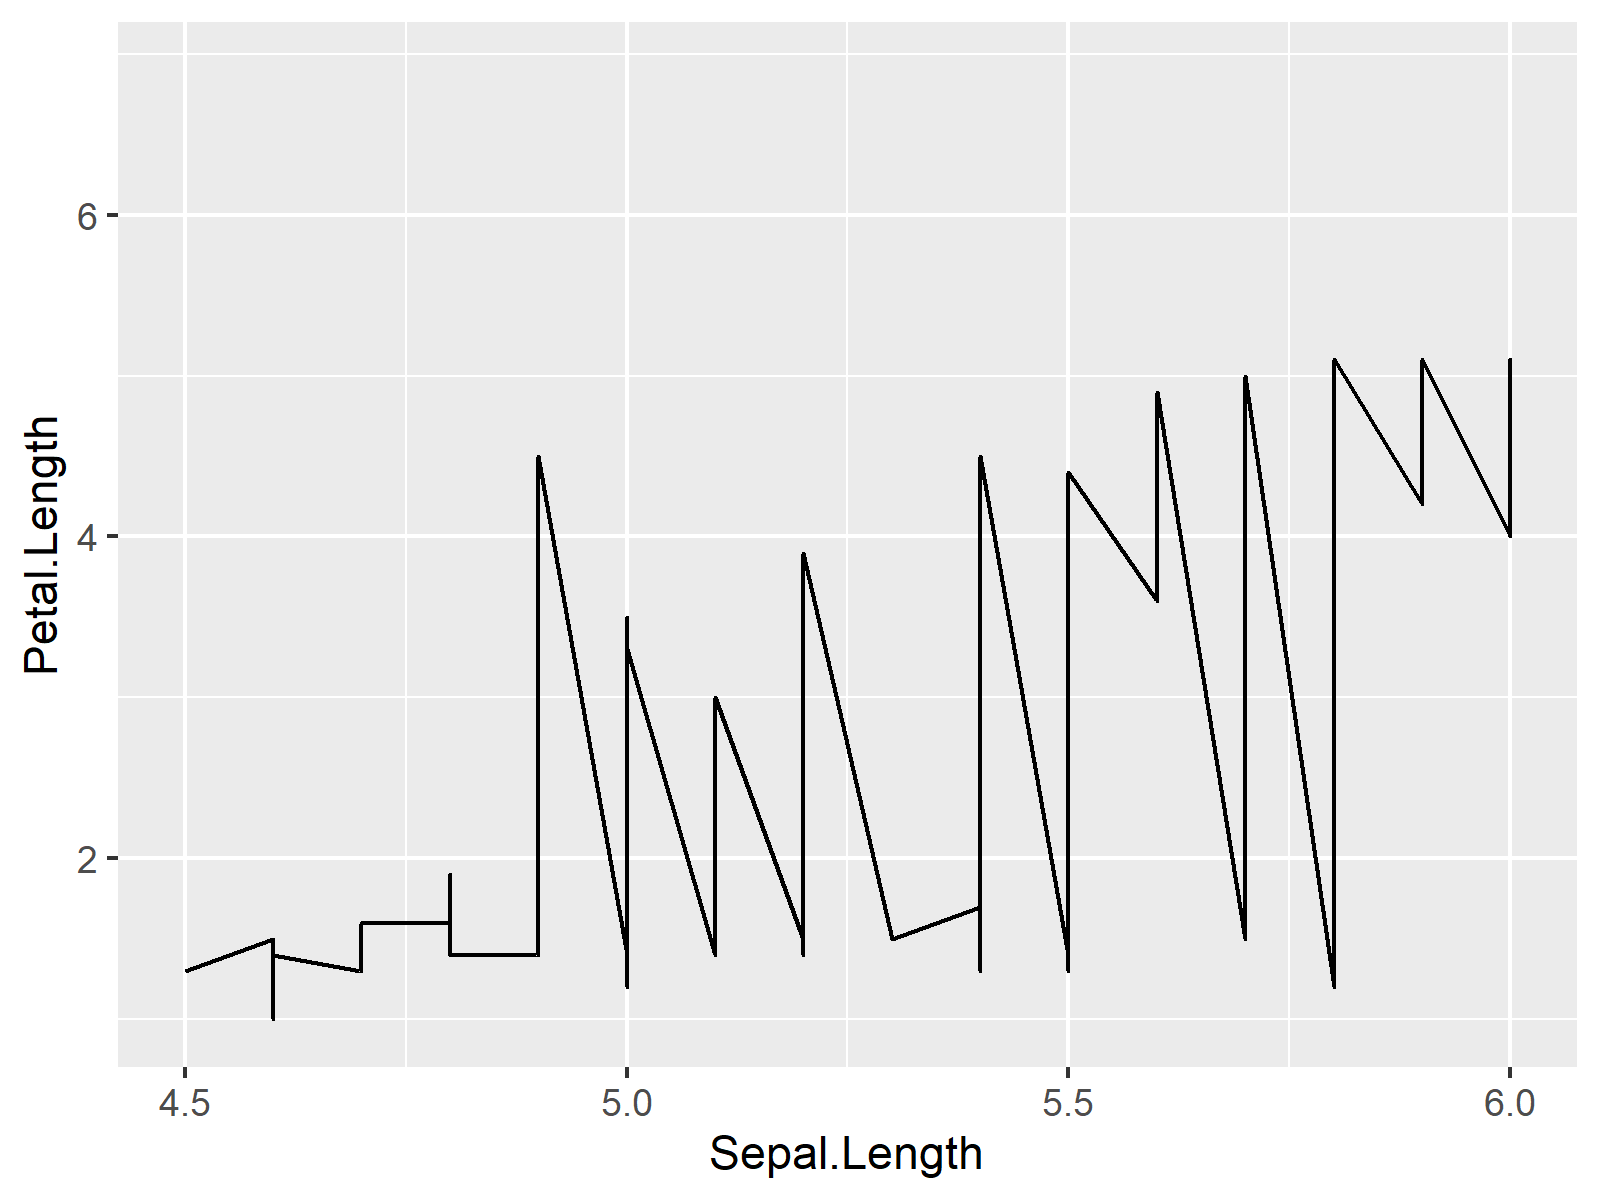
my_plot + # Manually set axis limits (cut-off values) scale_x_continuous(limits = c(4.5, 6)) # Warning message: # Removed 65 row(s) containing missing values (geom_path). |
my_plot + # Manually set axis limits (cut-off values) scale_x_continuous(limits = c(4.5, 6)) # Warning message: # Removed 65 row(s) containing missing values (geom_path).

Related Articles & Further Resources
Here, you may find some additional resources on topics such as ggplot2 and groups.
