R Set Color, pch & cex of Specific Point in Graphic (Example Code)
This article illustrates how to modify color, shape, and size of points in a scatterplot in the R programming language.
Creation of Example Data
data(iris) # Iris data set head(iris) # Sepal.Length Sepal.Width Petal.Length Petal.Width Species # 1 5.1 3.5 1.4 0.2 setosa # 2 4.9 3.0 1.4 0.2 setosa # 3 4.7 3.2 1.3 0.2 setosa # 4 4.6 3.1 1.5 0.2 setosa # 5 5.0 3.6 1.4 0.2 setosa # 6 5.4 3.9 1.7 0.4 setosa |
data(iris) # Iris data set head(iris) # Sepal.Length Sepal.Width Petal.Length Petal.Width Species # 1 5.1 3.5 1.4 0.2 setosa # 2 4.9 3.0 1.4 0.2 setosa # 3 4.7 3.2 1.3 0.2 setosa # 4 4.6 3.1 1.5 0.2 setosa # 5 5.0 3.6 1.4 0.2 setosa # 6 5.4 3.9 1.7 0.4 setosa
Example: Set Color of Specific Data Point in Graph Using ifelse() Function
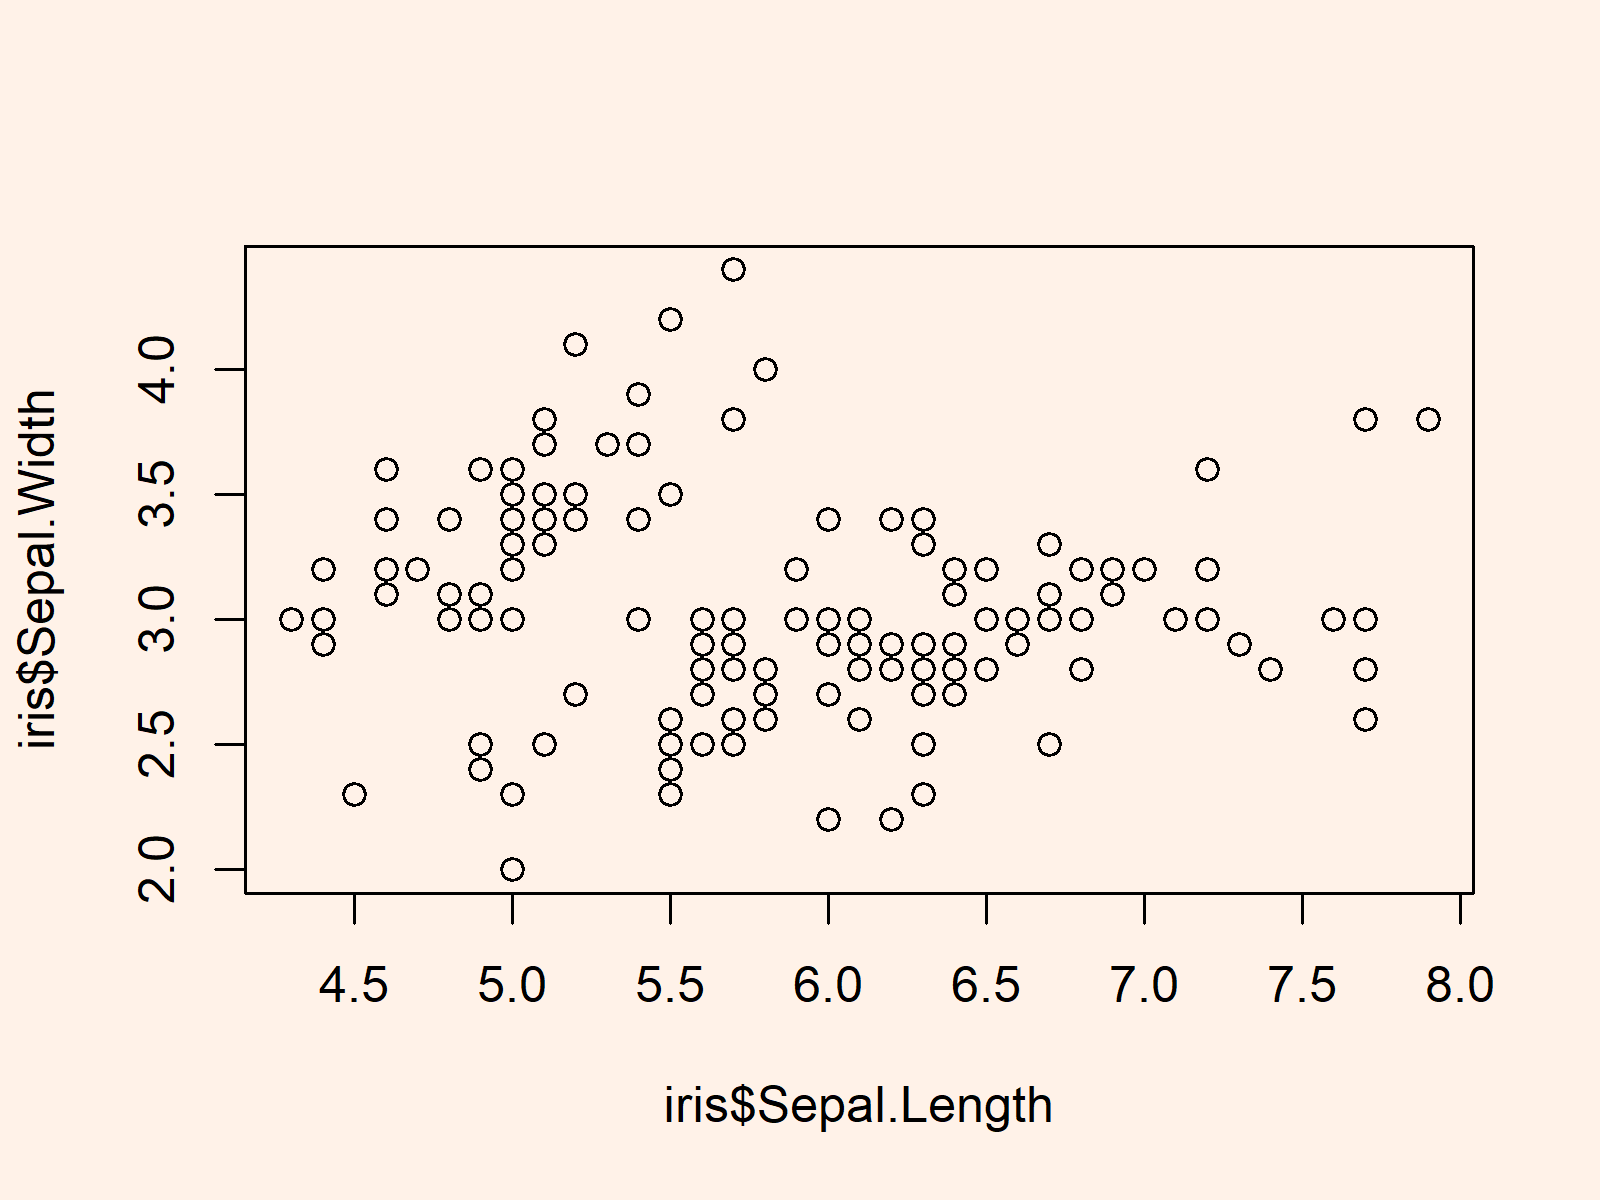
plot(iris$Sepal.Length, # Draw plot without manual specifications iris$Sepal.Width) |
plot(iris$Sepal.Length, # Draw plot without manual specifications iris$Sepal.Width)

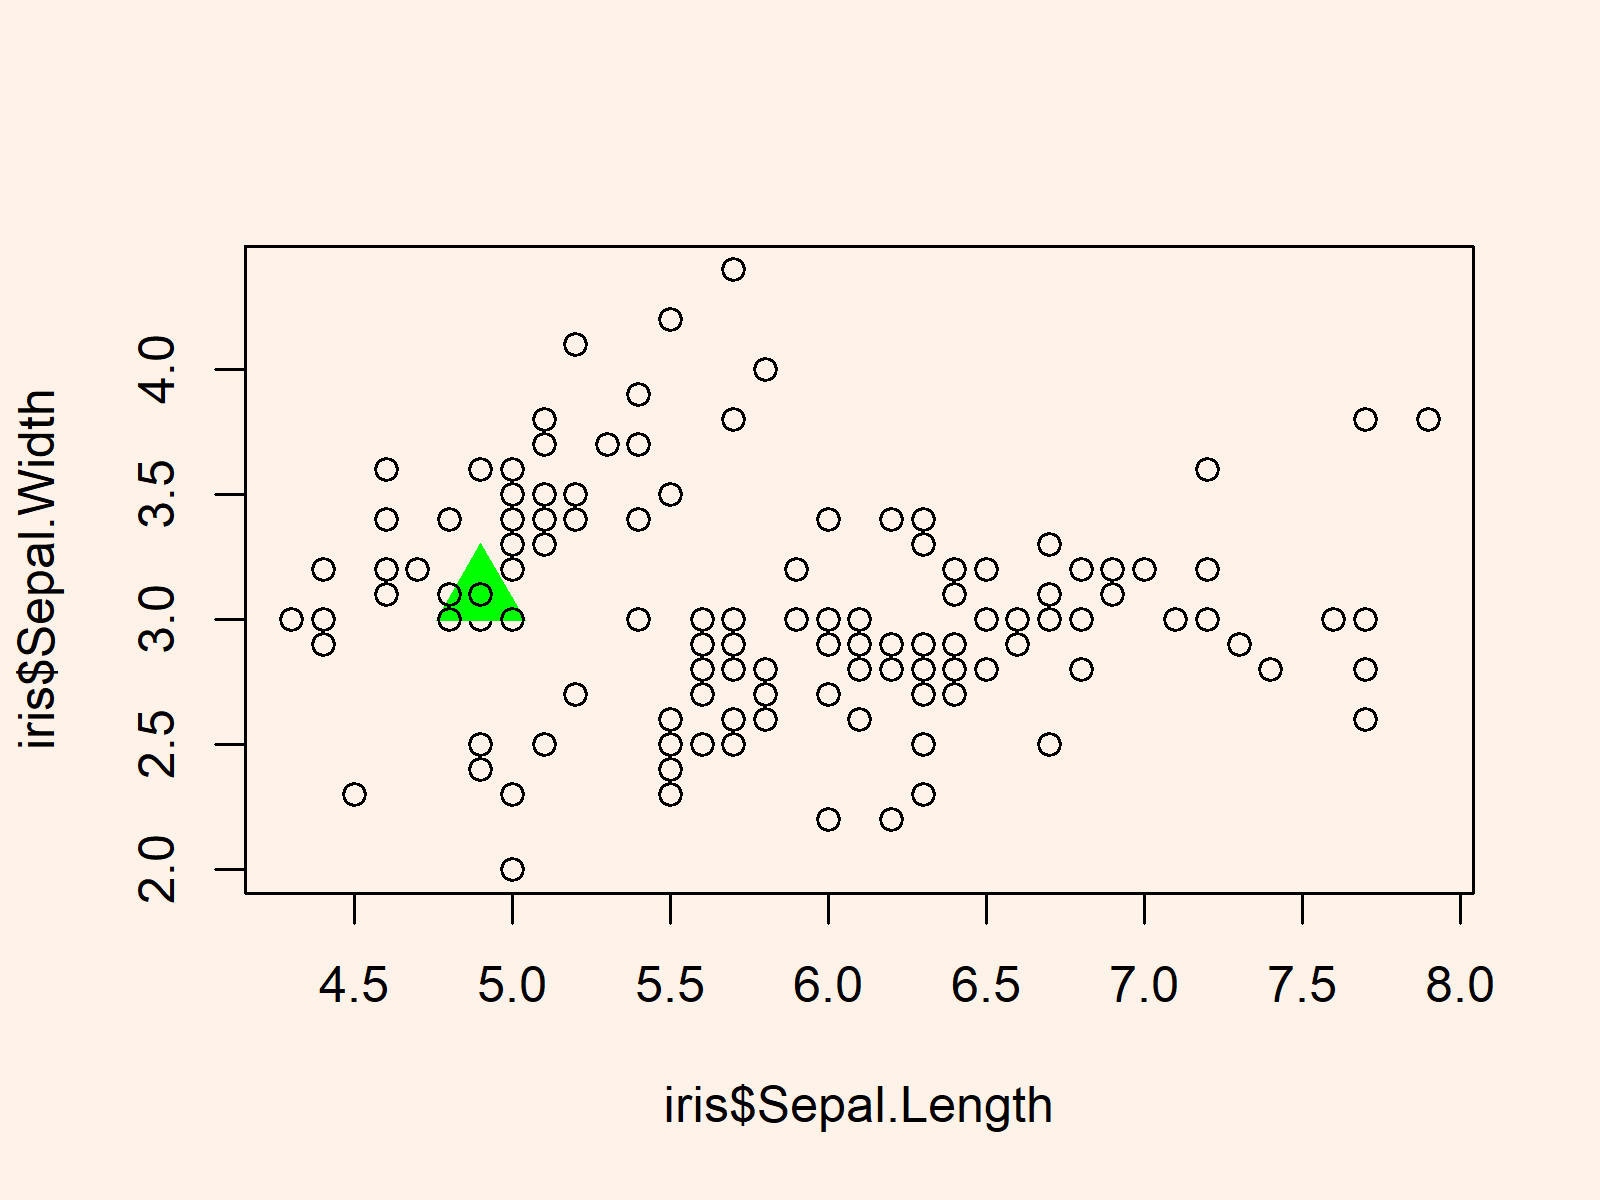
iris_colors <- rep("black", nrow(iris)) # Change color of one point iris_colors[10] <- "green" |
iris_colors <- rep("black", nrow(iris)) # Change color of one point iris_colors[10] <- "green"
iris_pch <- rep(1, nrow(iris)) # Change pch of one point iris_pch[10] <- 17 |
iris_pch <- rep(1, nrow(iris)) # Change pch of one point iris_pch[10] <- 17
iris_cex <- rep(1, nrow(iris)) # Change cex of one point iris_cex[10] <- 3 |
iris_cex <- rep(1, nrow(iris)) # Change cex of one point iris_cex[10] <- 3
plot(iris$Sepal.Length, # Draw plot with manual specifications iris$Sepal.Width, col = iris_colors, pch = iris_pch, cex = iris_cex) |
plot(iris$Sepal.Length, # Draw plot with manual specifications iris$Sepal.Width, col = iris_colors, pch = iris_pch, cex = iris_cex)

Related Tutorials
You may find some related R programming tutorials on topics such as ggplot2, graphics in R, data objects, and plot legends in the list below.
