How to Apply the layout() Function in R (Example Code)
This tutorial illustrates how to apply the layout() function in R.
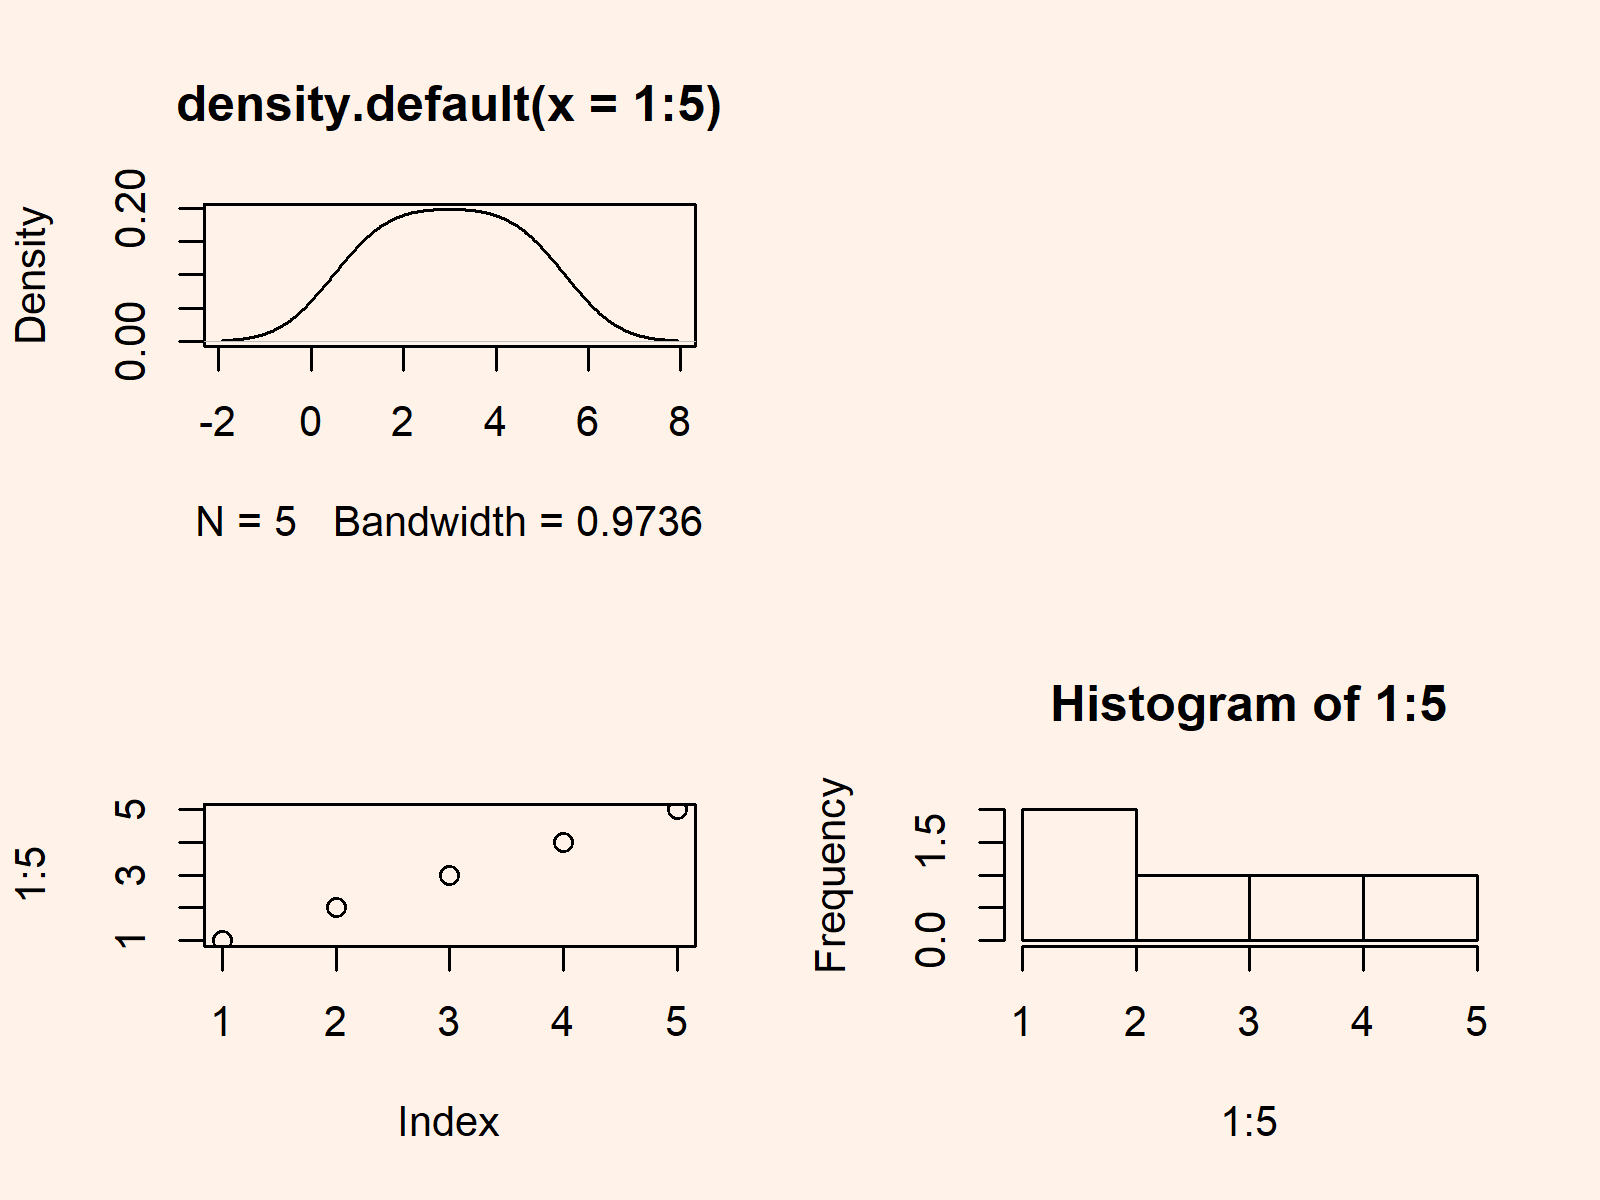
Example: Create Layout of Graphics Using layout() Function in R Programming
my_mat <- matrix(c(1, 2, 0, 3), nrow = 2) # Defining layout matrix my_mat # Show matrix in RStudio console # [,1] [,2] # [1,] 1 0 # [2,] 2 3 |
my_mat <- matrix(c(1, 2, 0, 3), nrow = 2) # Defining layout matrix my_mat # Show matrix in RStudio console # [,1] [,2] # [1,] 1 0 # [2,] 2 3
layout(my_mat) # Applying layout() function in R |
layout(my_mat) # Applying layout() function in R
plot(density(1:5)) # Create graph for position 1 plot(1:5) # Create graph for position 2 hist(1:5) # Create graph for position 3 |
plot(density(1:5)) # Create graph for position 1 plot(1:5) # Create graph for position 2 hist(1:5) # Create graph for position 3

