R Error in barplot.default() : ‘height’ must be a vector or a matrix (2 Examples)
In this tutorial, I’ll explain how to debug the “Error in barplot.default() : ‘height’ must be a vector or a matrix” in the R programming language.
Example 1: Replicating the Error Message – ‘height’ must be a vector or a matrix
data(iris) # Loading iris data set iris_new <- iris[c(1, 51, 101), c(1, 5)] # Modify data for example iris_new # Display example data in RStudio console # Sepal.Length Species # 1 5.1 setosa # 51 7.0 versicolor # 101 6.3 virginica |
data(iris) # Loading iris data set iris_new <- iris[c(1, 51, 101), c(1, 5)] # Modify data for example iris_new # Display example data in RStudio console # Sepal.Length Species # 1 5.1 setosa # 51 7.0 versicolor # 101 6.3 virginica
barplot(iris_new) # barplot function leads to error message # Error in barplot.default(iris_new) : # 'height' must be a vector or a matrix |
barplot(iris_new) # barplot function leads to error message # Error in barplot.default(iris_new) : # 'height' must be a vector or a matrix
Example 2: Solving the Error Message – ‘height’ must be a vector or a matrix
iris_new_barplot <- iris_new$Sepal.Length # Modify data for barplot names(iris_new_barplot) <- iris_new$Species iris_new_barplot # setosa versicolor virginica # 5.1 7.0 6.3 |
iris_new_barplot <- iris_new$Sepal.Length # Modify data for barplot names(iris_new_barplot) <- iris_new$Species iris_new_barplot # setosa versicolor virginica # 5.1 7.0 6.3
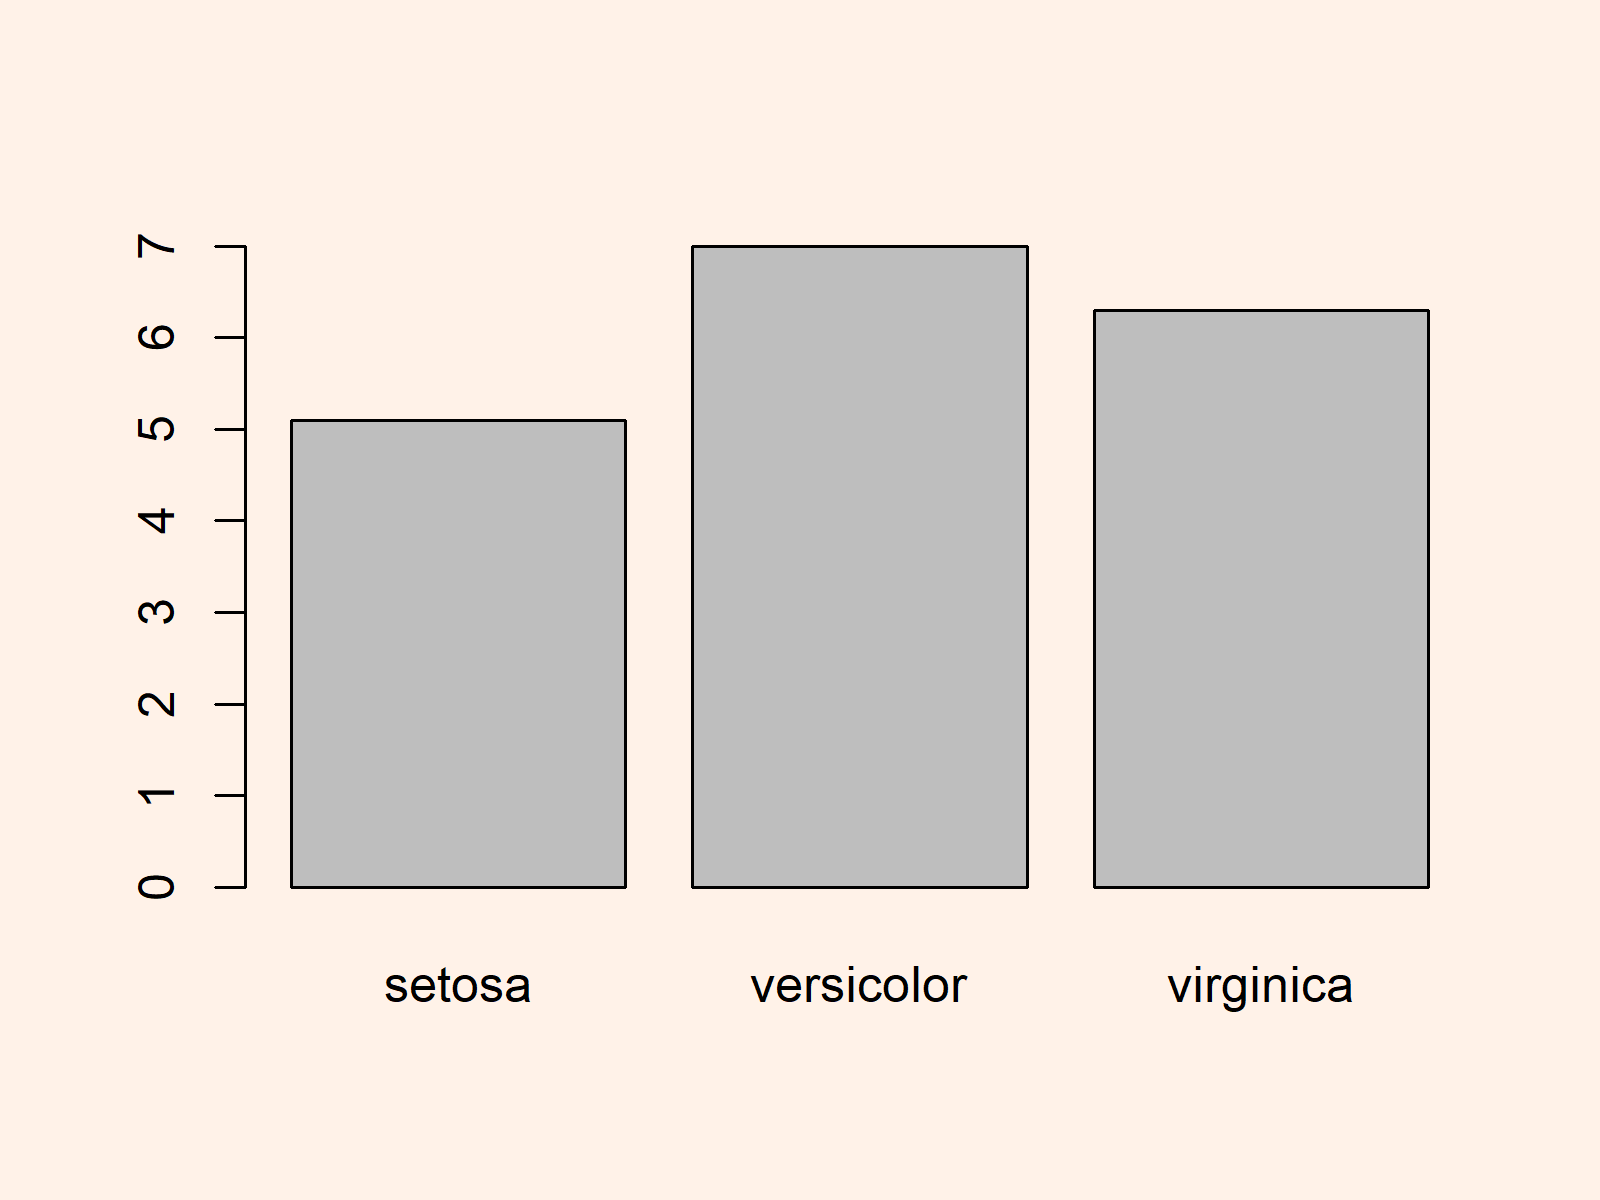
barplot(iris_new_barplot) # Applying barplot function without errors |
barplot(iris_new_barplot) # Applying barplot function without errors

Further Resources & Related Tutorials
In the following, you can find some additional resources that are similar to the content of this article:
