R How to Annotate Bold & Italic Text to ggplot2 Graph (2 Examples)
On this page, I’ll explain how to annotate bold and italic text to a ggplot2 graphic in the R programming language.
Setting up the Examples
data(iris) # Example data head(iris) # Sepal.Length Sepal.Width Petal.Length Petal.Width Species # 1 5.1 3.5 1.4 0.2 setosa # 2 4.9 3.0 1.4 0.2 setosa # 3 4.7 3.2 1.3 0.2 setosa # 4 4.6 3.1 1.5 0.2 setosa # 5 5.0 3.6 1.4 0.2 setosa # 6 5.4 3.9 1.7 0.4 setosa |
data(iris) # Example data head(iris) # Sepal.Length Sepal.Width Petal.Length Petal.Width Species # 1 5.1 3.5 1.4 0.2 setosa # 2 4.9 3.0 1.4 0.2 setosa # 3 4.7 3.2 1.3 0.2 setosa # 4 4.6 3.1 1.5 0.2 setosa # 5 5.0 3.6 1.4 0.2 setosa # 6 5.4 3.9 1.7 0.4 setosa
install.packages("ggplot2")# Install ggplot2 package library("ggplot2") # Load ggplot2 package |
install.packages("ggplot2")# Install ggplot2 package library("ggplot2") # Load ggplot2 package
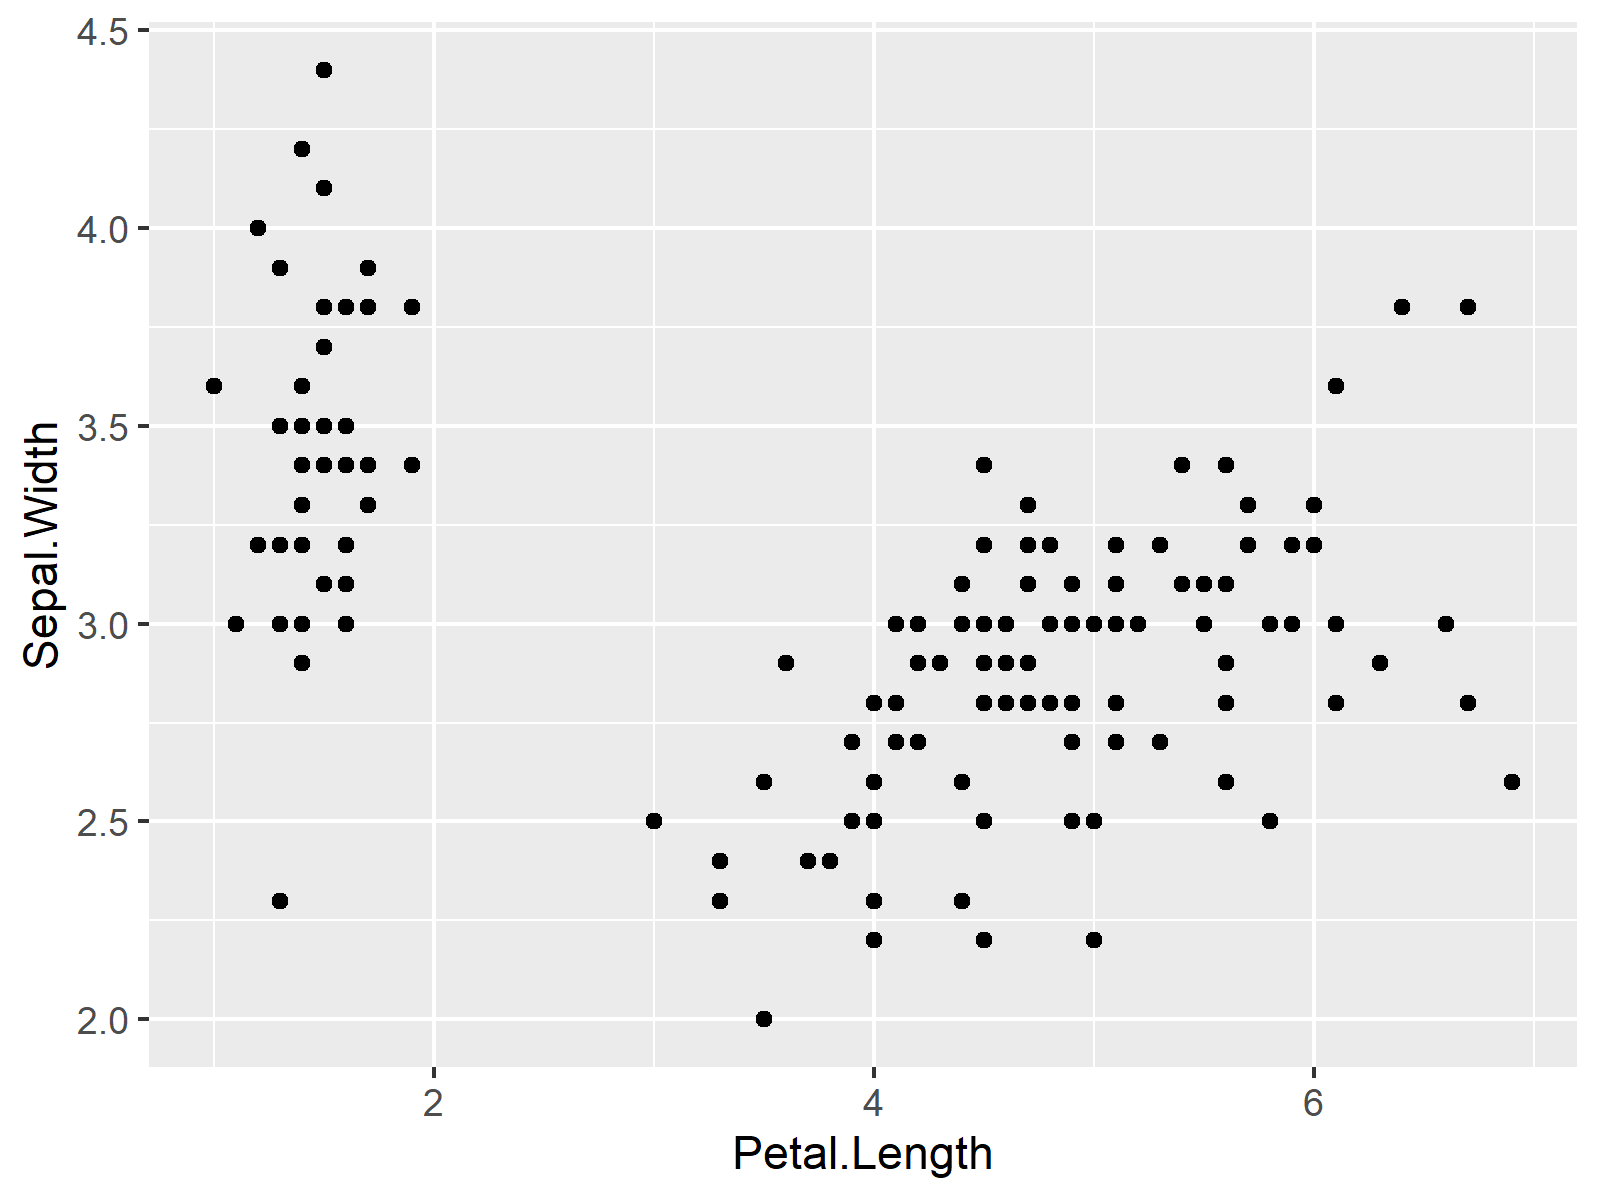
ggp <- ggplot(iris, # ggplot2 graph without text aes(Petal.Length, Sepal.Width)) + geom_point() ggp |
ggp <- ggplot(iris, # ggplot2 graph without text aes(Petal.Length, Sepal.Width)) + geom_point() ggp

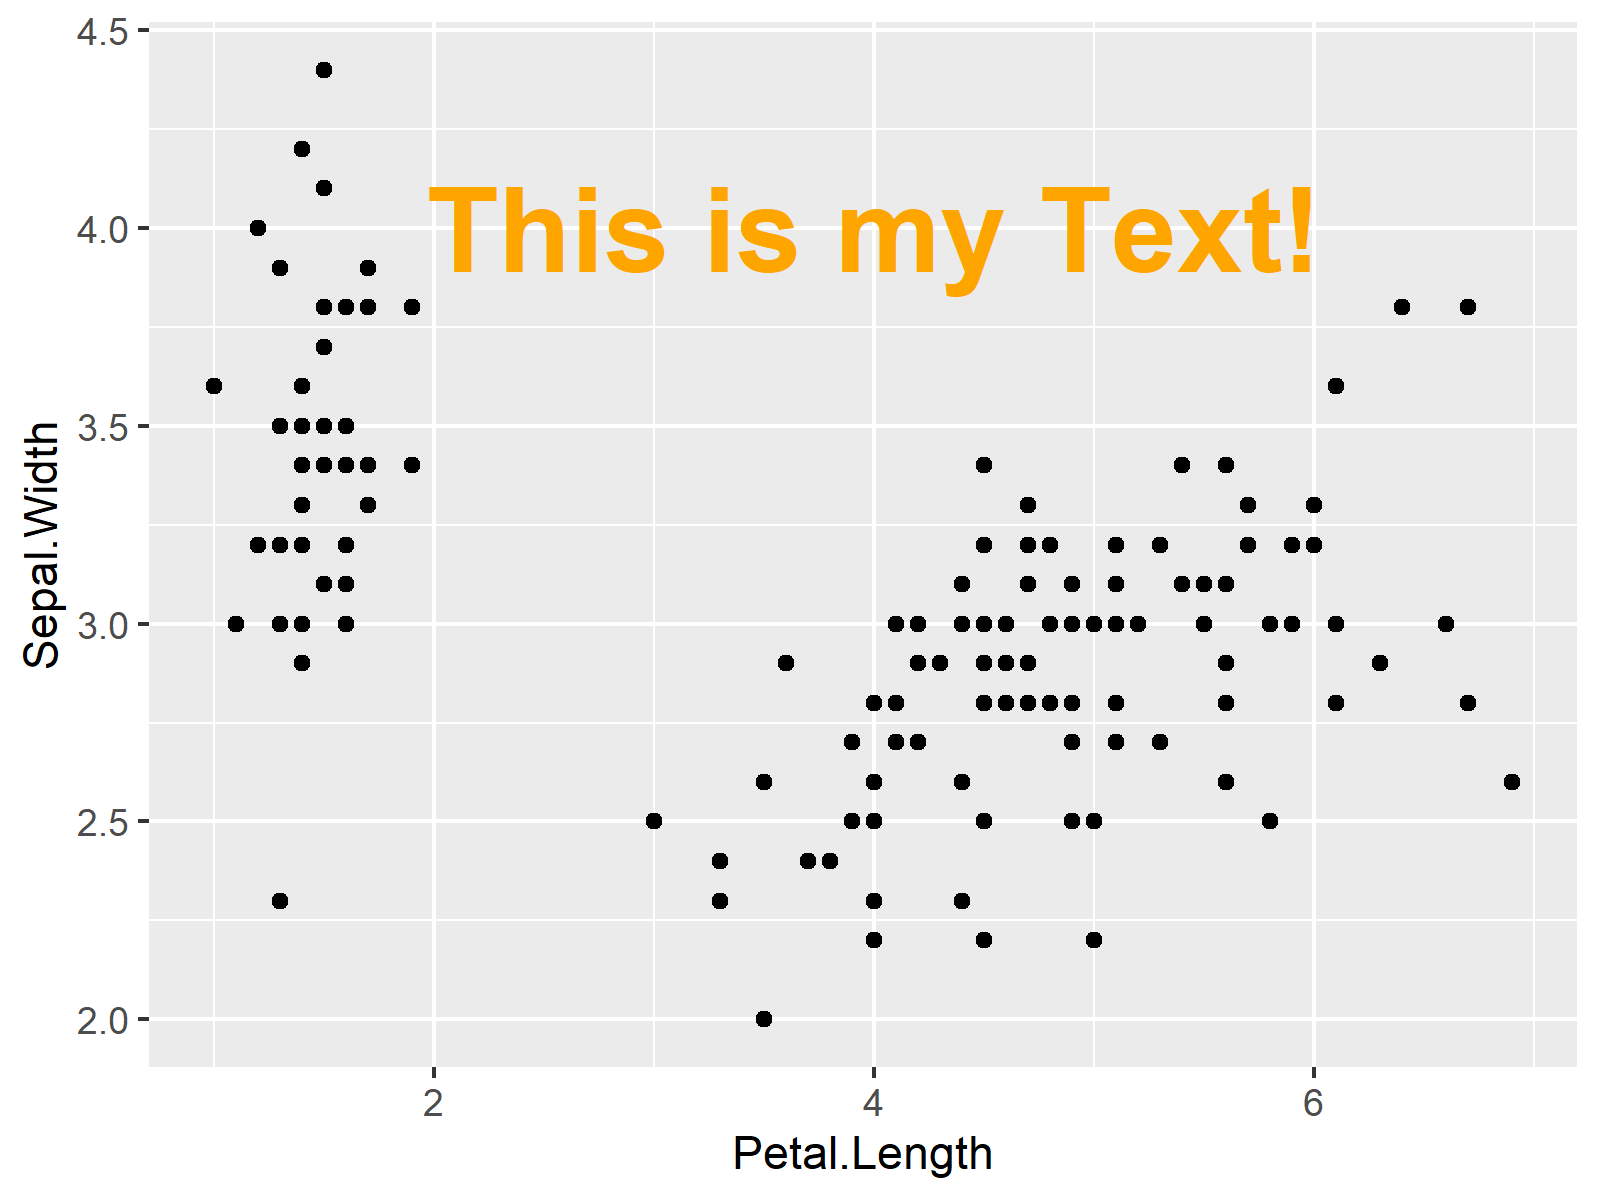
Example 1: Adding Bold Text to ggplot2 Graphic Using fontface = “bold”
ggp + # Add text element to plot annotate("text", x = 4, y = 4, size = 10, col = "orange", label = "This is my Text!", fontface = "bold") |
ggp + # Add text element to plot annotate("text", x = 4, y = 4, size = 10, col = "orange", label = "This is my Text!", fontface = "bold")

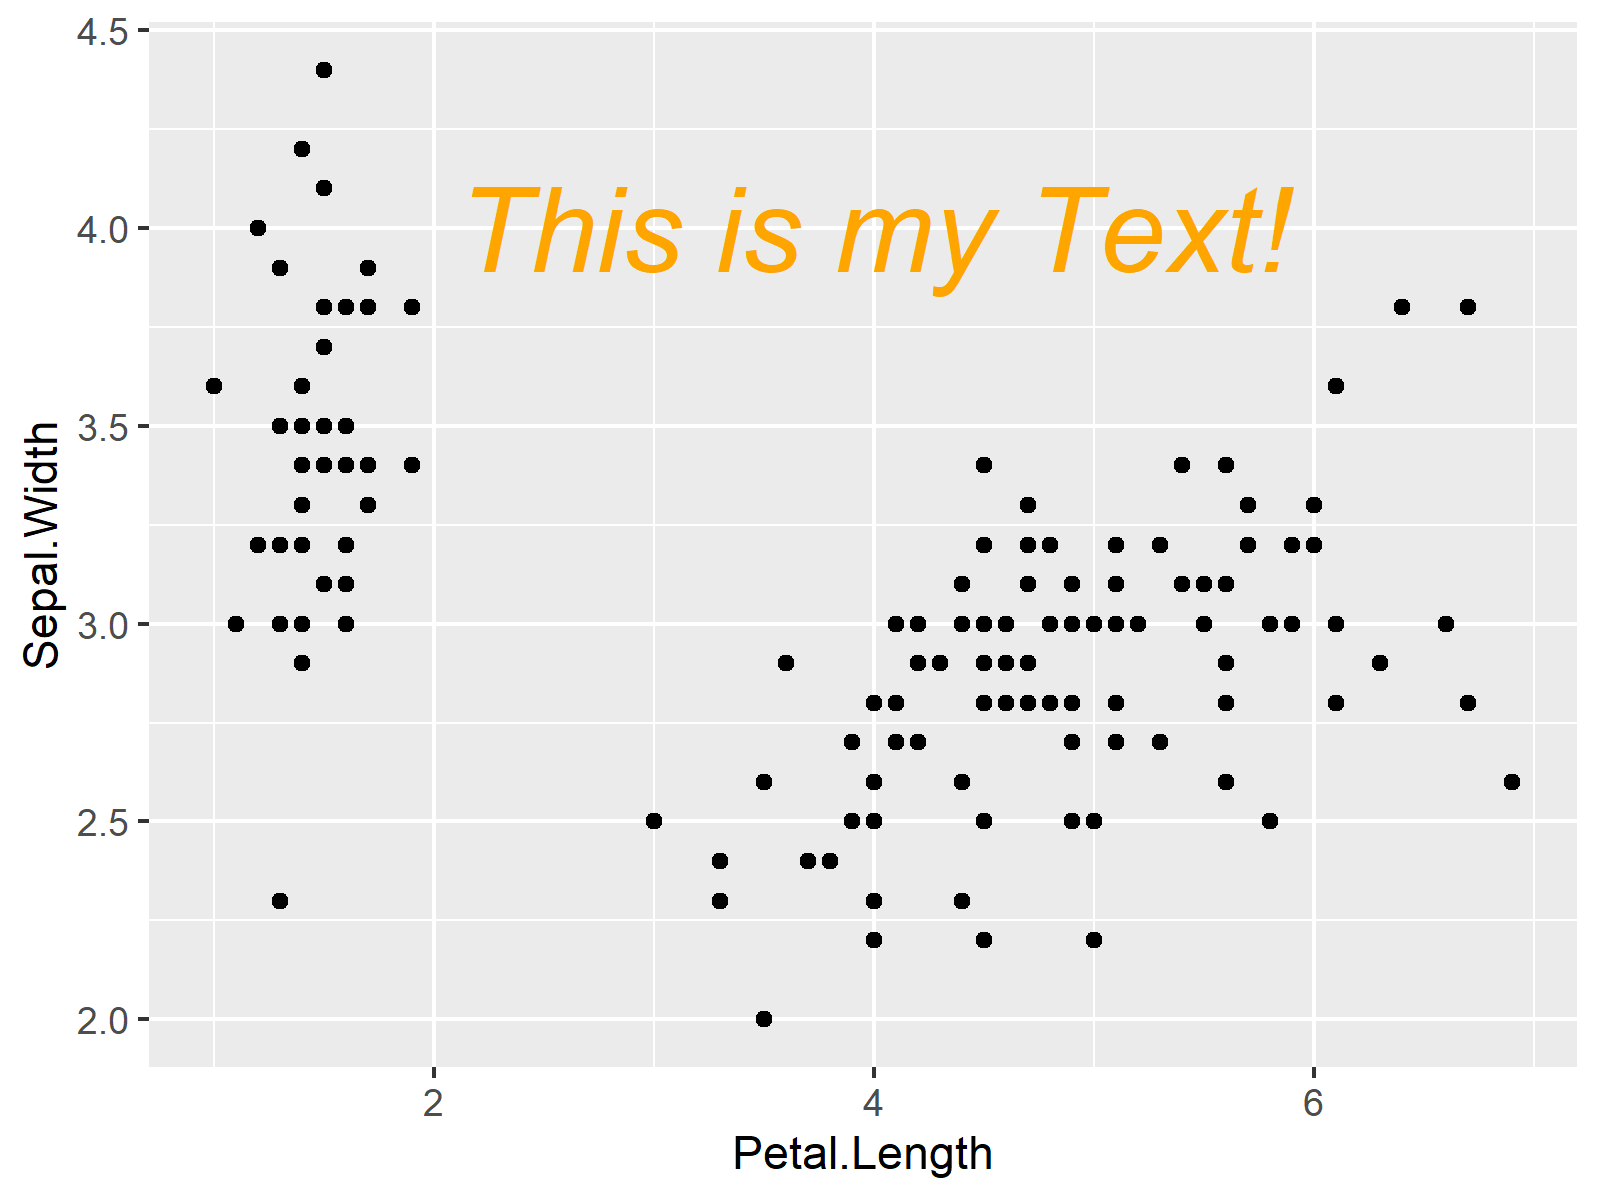
Example 2: Adding Italic Text to ggplot2 Graphic Using fontface = “italic”
ggp + # Add text element to plot annotate("text", x = 4, y = 4, size = 10, col = "orange", label = "This is my Text!", fontface = "italic") |
ggp + # Add text element to plot annotate("text", x = 4, y = 4, size = 10, col = "orange", label = "This is my Text!", fontface = "italic")

Related Articles & Further Resources
Please find some related R programming tutorials on topics such as text elements, graphics in R, and ggplot2 in the following list.
